Looking for the right heatmap tool? Here's a quick breakdown of the top options:
Top Picks at a Glance:
- Best Overall: Hotjar (57.65% market share, 291,000+ customers)
- Best Free Tool: Microsoft Clarity (unlimited traffic, no cost)
- Best Budget Option: Lucky Orange (starts at $14/month)
- Best Enterprise: Contentsquare (used by 30% of Fortune 100)
| Tool | Best For | Starting Price | Key Feature |
|---|---|---|---|
| Hotjar | All-around use | €32/month | Unlimited heatmaps |
| CrazyEgg | A/B testing | $49/month | Built-in testing tools |
| Mouseflow | Session tracking | $31/month | 6 heatmap types |
| FullStory | Enterprise | Custom | 8 heatmap types |
| Microsoft Clarity | Free option | Free | No traffic limits |
| Lucky Orange | Small business | $14/month | Real-time tracking |
| Contentsquare | Large enterprise | $10k+/month | AI insights |
| VWO | Testing focus | $99/month | Cross-device tracking |
What These Tools Track:
- Click/tap patterns
- Scroll depth
- Mouse movements
- User attention
- Error clicks
- Rage clicks
Pick your tool based on:
- Your monthly traffic
- Budget constraints
- Team size
- Feature needs
- Integration requirements
For most websites, Hotjar or Microsoft Clarity will handle basic heatmap needs. Larger sites should consider FullStory or Contentsquare for deeper analytics.
Related video from YouTube
Hotjar
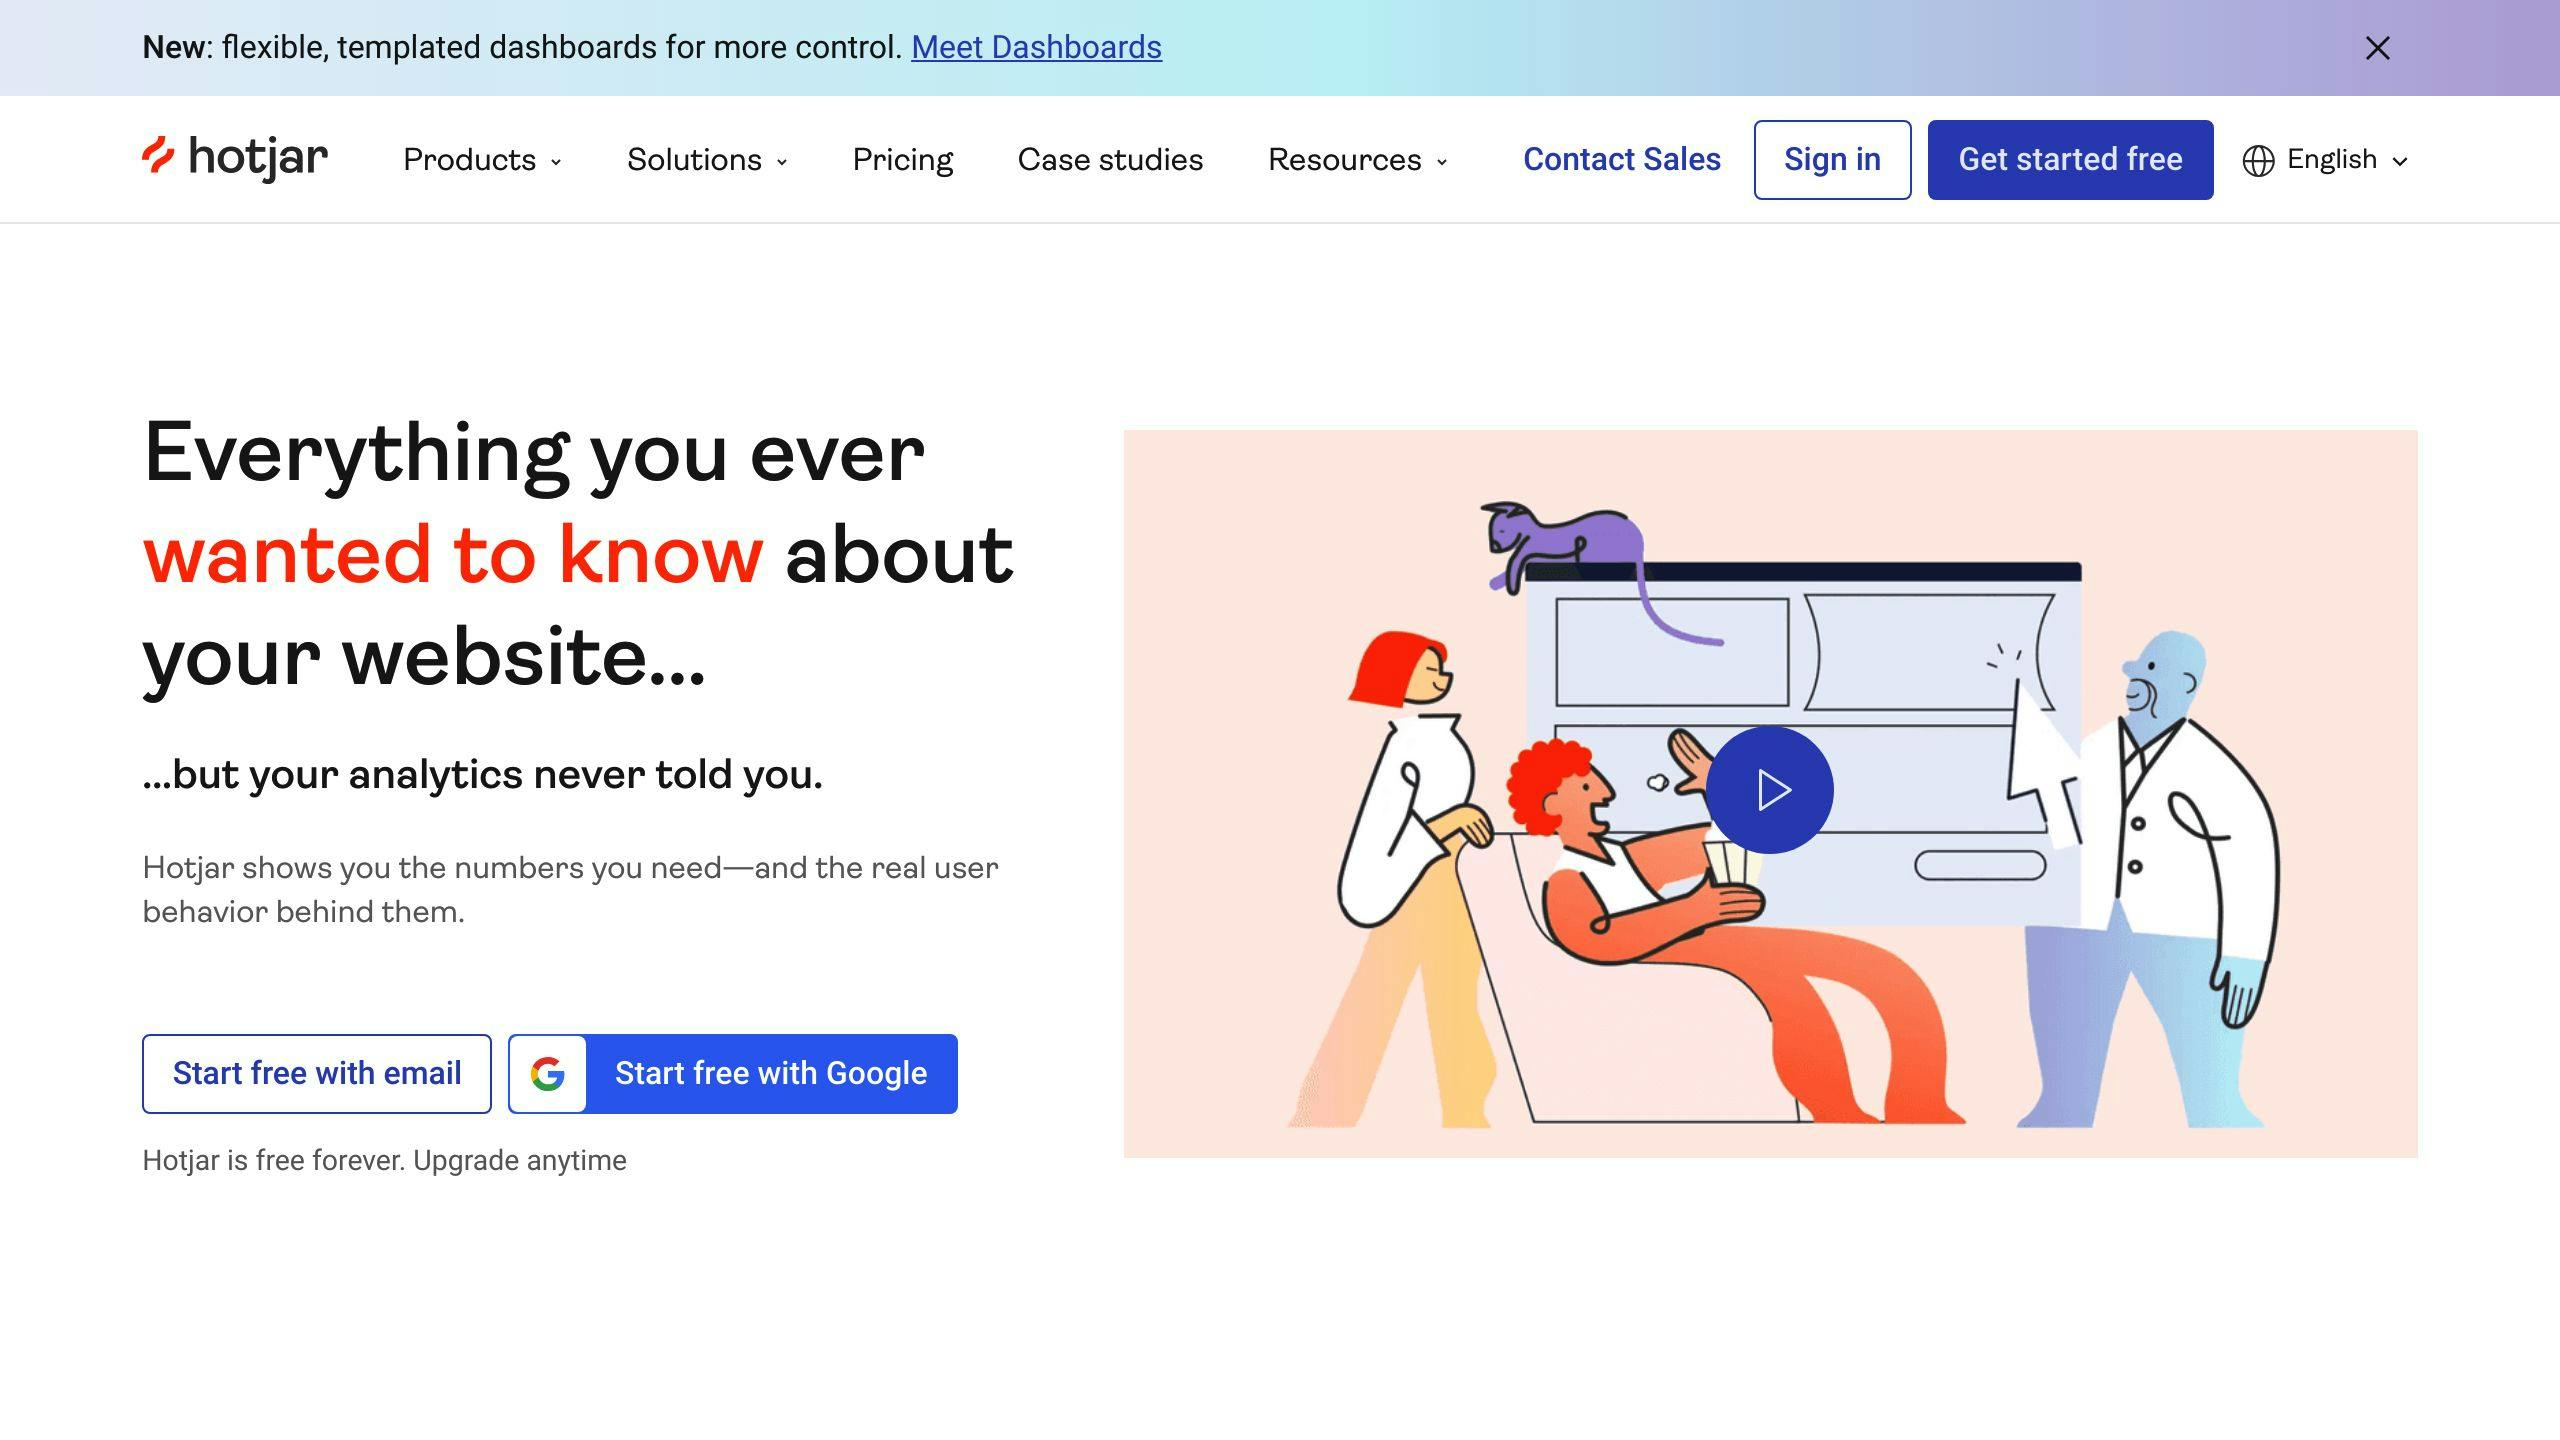
Hotjar leads the heatmap market with 291,000+ customers - that's 10x more than their next competitor, holding a 57.65% market share.
| Plan | Sessions | Key Features | Price |
|---|---|---|---|
| Free | 35/day | Unlimited heatmaps, Basic filtering | €0 |
| Plus | 100/day | Advanced filtering, Events API | €32/month |
| Business | 500+/day | Integrations, Identify API | €80/month |
| Scale | 500+/day | Funnels, Console tracking | €171/month |
The tool tracks three core user behaviors:
- Clicks and taps
- Mouse movement patterns
- How far users scroll
Their Engagement Zones feature shows all three behaviors in one view. No more switching between different maps to spot patterns.
What sets Hotjar apart:
- Track ALL pages with one code snippet
- Filter data by device type
- Connect with Google Analytics
- 115+ integrations (Business plan and up)
Here's what REAL users say about Hotjar:
Materials Market's CEO boosted revenue by £10,000+ yearly. How? Their scroll map showed mobile users missed the main CTA. Moving it up fixed the problem - conversions jumped 1.1%.
"We use Hotjar heatmaps in team meetings to spot UX problems fast" - Sara Parcero-Leites, Customer Knowledge Manager at Spotahome
At Techsmith, click maps showed users preferred clicking product images over buttons. The team made entire product sections clickable - a simple fix for better UX.
Power tip: Click anywhere on a heatmap to see related recordings. You'll know exactly WHY users do what they do.
Want to save money? Pay yearly for 20% off. Bundle Observe (heatmaps) with Ask (surveys) for another 20% discount.
2. CrazyEgg
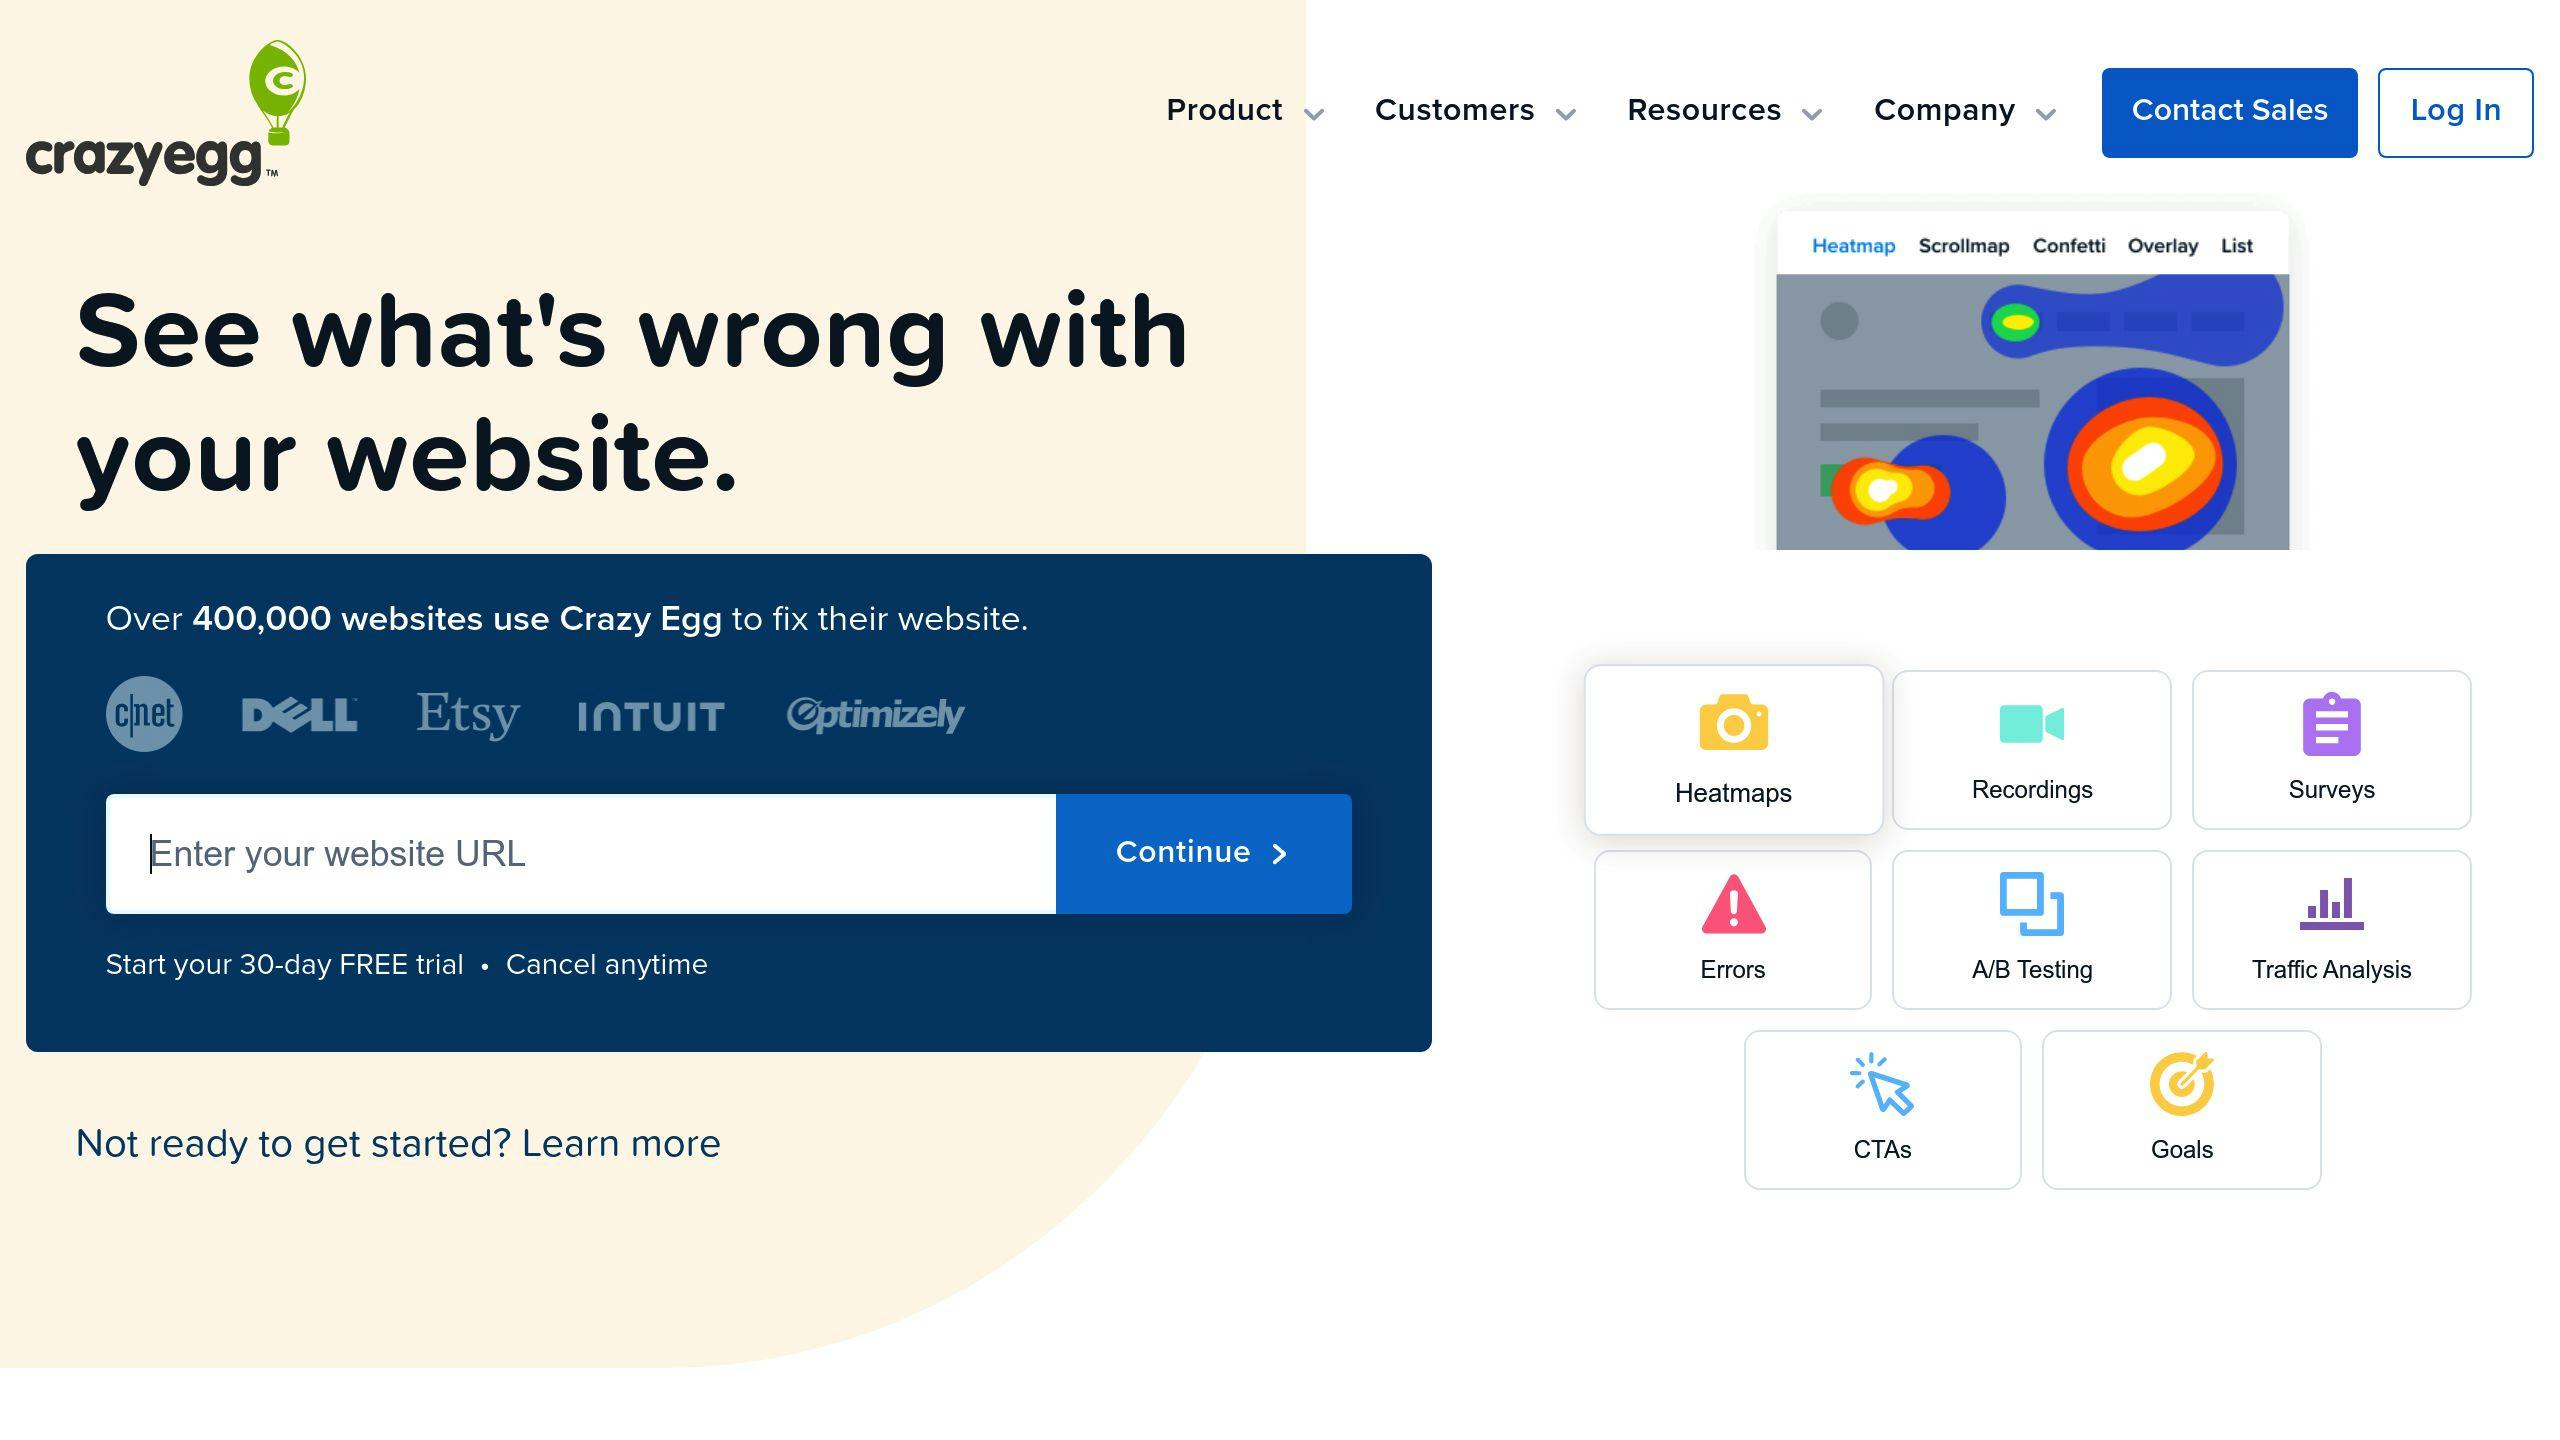
CrazyEgg helps 130,000 websites track user behavior with "snapshots" (their name for heatmaps). Here's what they offer:
| Plan | Price/Year | Features | Limits |
|---|---|---|---|
| Basic | $588 | Heatmaps, A/B testing | 50 snapshots, 500 recordings/month |
| Plus | $1,188 | Priority support, More snapshots | 100 snapshots, 1000 recordings/month |
The software tracks three main user actions:
- Where users click (Clickmaps)
- How they move their mouse (Hovermaps)
- How far they scroll (Scrollmaps)
Getting started: Just add their JavaScript to your site's <head> tag. Then pick which pages and devices you want to track.
How it's different from Hotjar:
- You set up each heatmap by hand (Hotjar does this for you)
- Max 50 heatmaps (Hotjar has no limit)
- Won't connect with Google Analytics
- Old training videos (6+ years old)
But CrazyEgg has some GREAT features too. You can run A/B tests without touching code, and build pop-ups and sticky bars with their CTA tools.
Here's what users say:
"The heat mapping is super easy to set up and analyze. Gives us exactly the information we are looking for." - Angie D., Digital Marketing Manager
Want proof it works? WallMonkeys tested different messages and images using CrazyEgg's tools. Their revenue jumped 550%.
Save money: Start with the $588/year basic plan. It has everything you need - heatmaps and A/B testing included.
Two more success stories:
Pronto's scroll maps showed users hunting for contact info in the footer. They moved their CTA to the top of the page and got 24% more leads.
Couple (previously Pair) used heatmaps to spot a problem: navigation and social buttons were pulling attention from their main goal. Moving these buttons helped boost app downloads by 25%.
3. Mouseflow
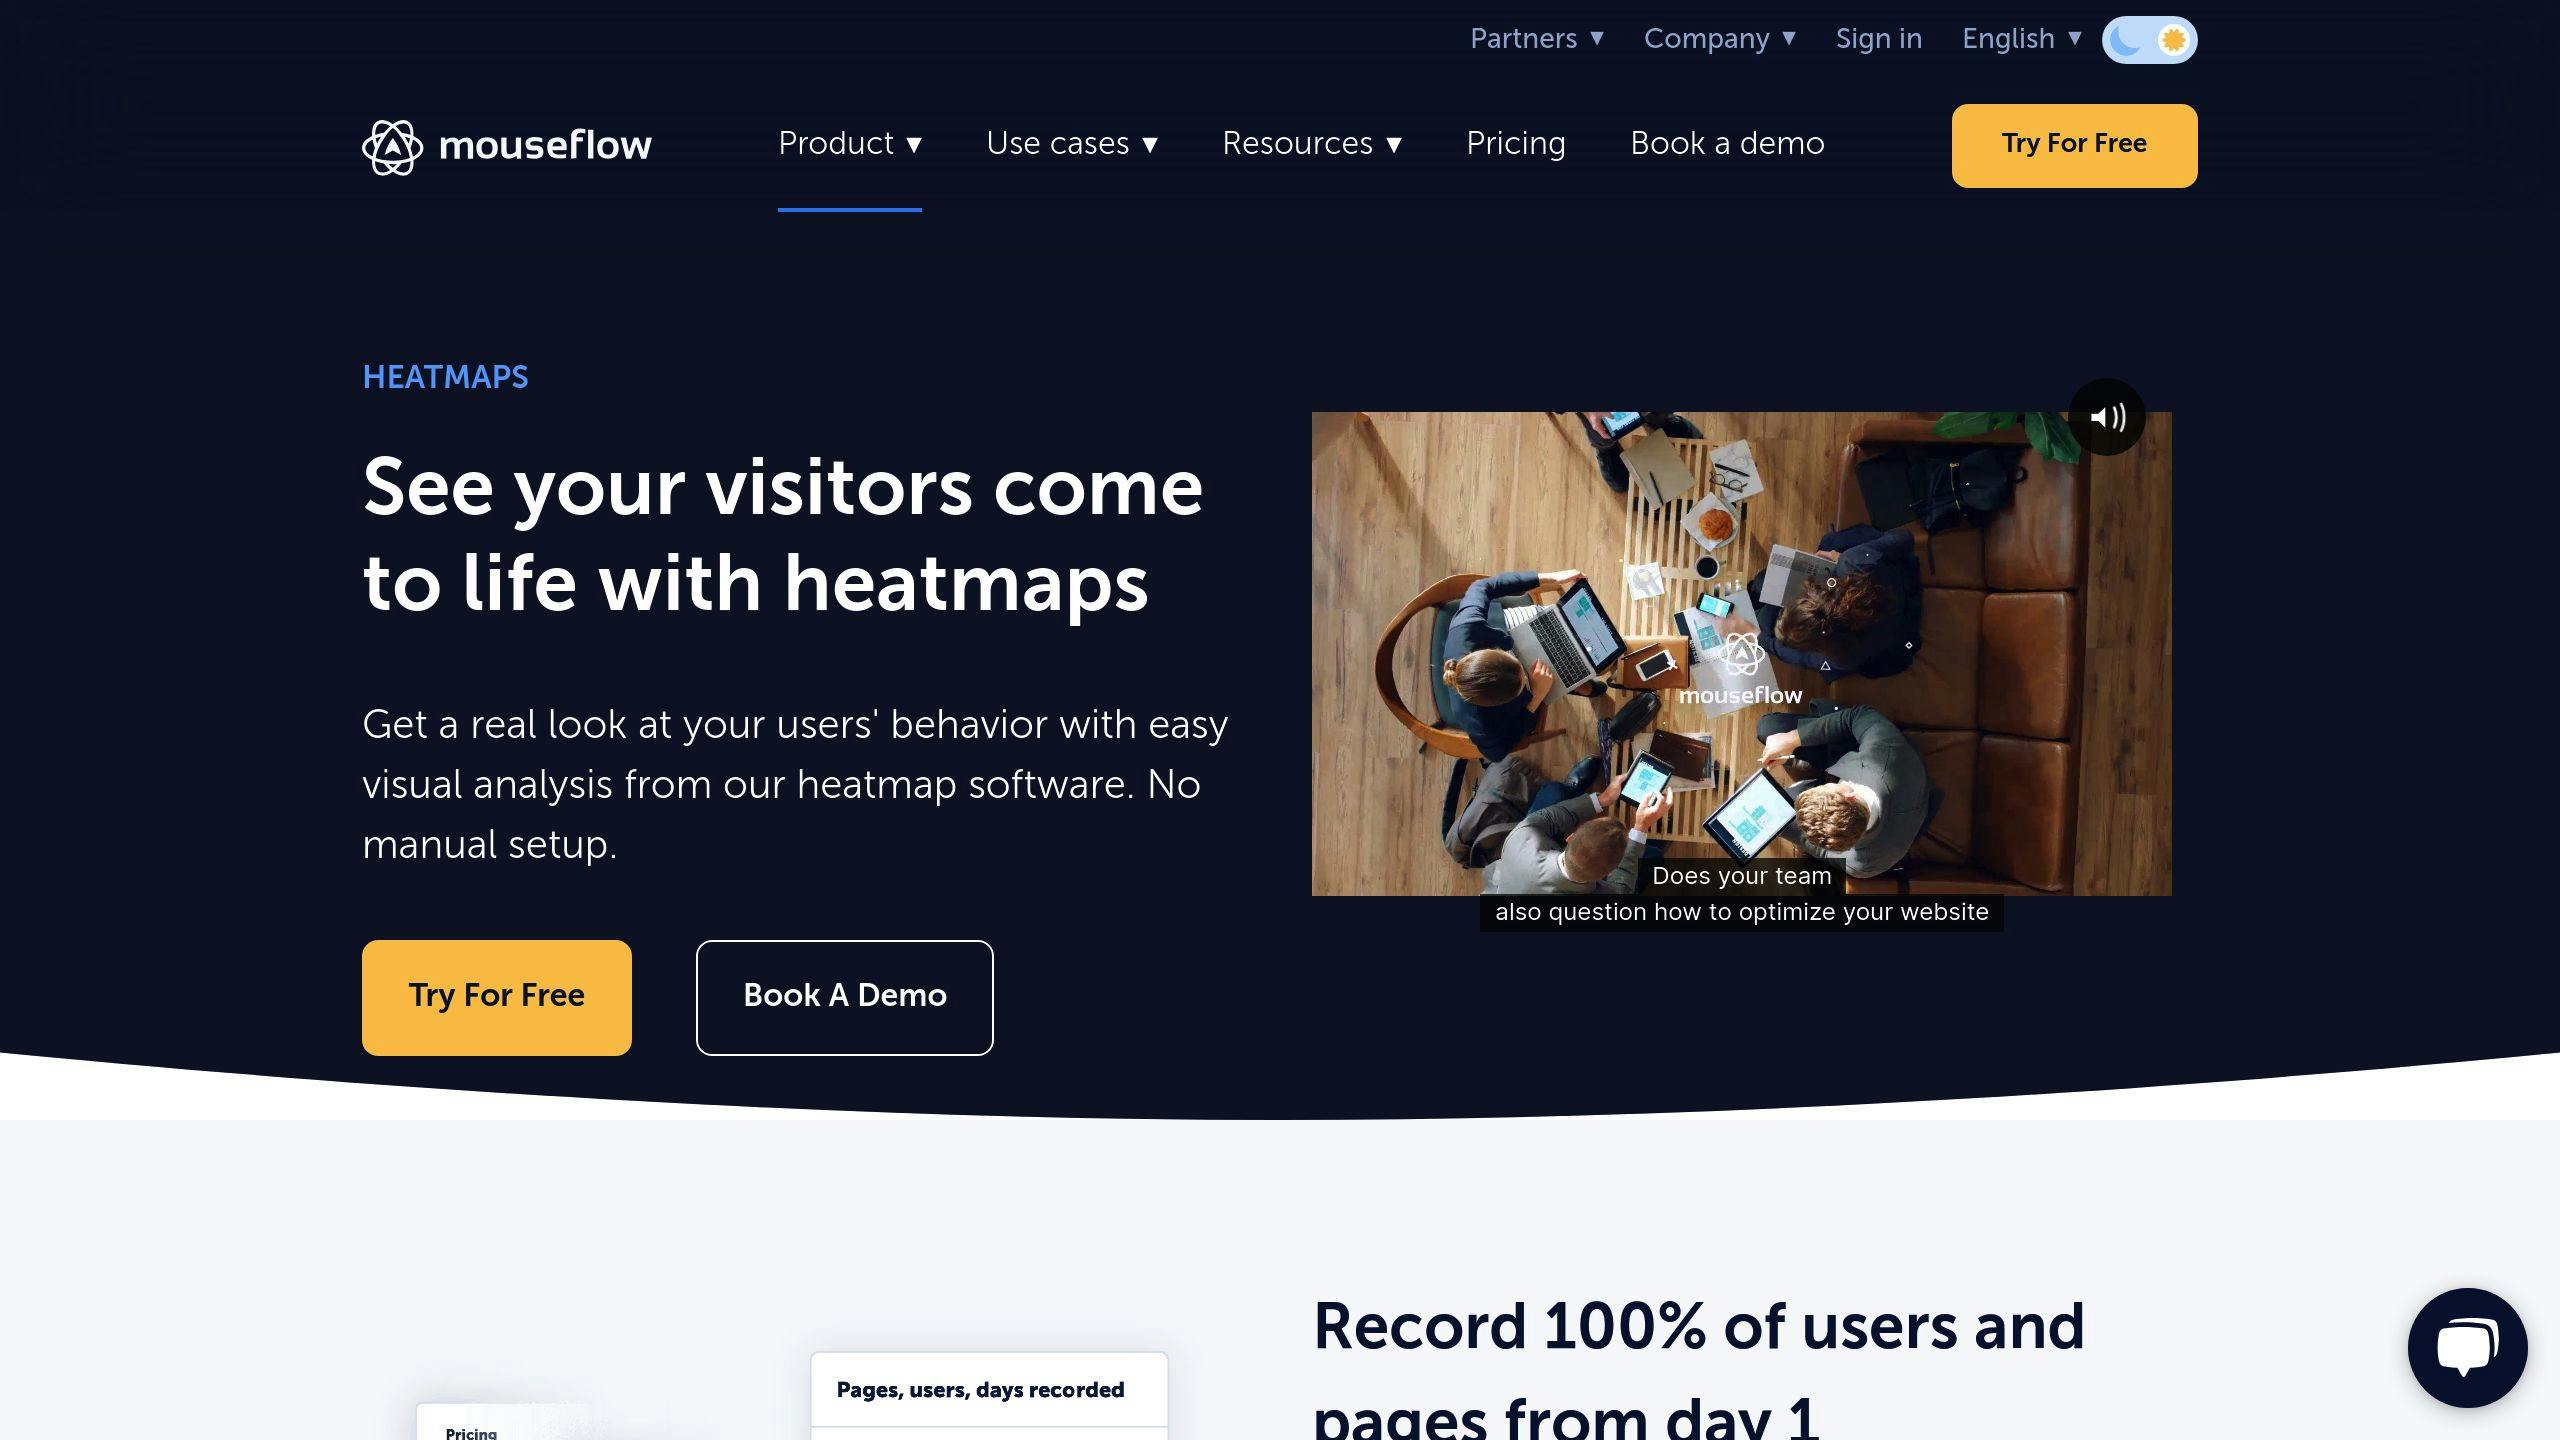
Mouseflow tracks how people use your website through 6 different heatmaps - that's double what most other tools offer. The company started in 2009 and has grown into a go-to choice for website behavior analysis.
Here's what each heatmap shows you:
| Heatmap Type | What It Shows |
|---|---|
| Click | Where users tap or click |
| Move | Mouse movement patterns |
| Scroll | How far users scroll |
| Attention | Time spent on page sections |
| Geo | Visitor locations |
| Live | Real-time user activity |
Want to know what it costs? Here's the breakdown:
| Plan | Price/Month | Features | Storage |
|---|---|---|---|
| Free | $0 | 500 recordings, 1 website | 1 month |
| Starter | $31 | 5,000 recordings, 1 website | 3 months |
| Growth | $109 | 15,000 recordings, 3 websites | 6 months |
| Business | $219 | 50,000 recordings, 5 websites | 12 months |
| Pro | $399 | 150,000 recordings, 10 websites | 12 months |
What Makes It Different?
- Records EVERY session (no sampling)
- Spots 7+ user friction points automatically
- Handles dynamic content without issues
- Comes with 100+ filters on all plans
- Lets you save recordings
- Includes point-and-click tagging
Getting started takes just 4 steps:
- Sign up
- Add the code to your site
- Choose your pages
- Watch the data roll in
The tool's Friction Score shows you exactly where users get stuck:
- JavaScript errors
- Form submission fails
- Rage clicks
- Dead clicks
- U-turns (quick page exits)
It connects with 30+ platforms and meets top security standards. Users love it too - with 4.7/5 stars from 680 reviews.
Want to save money? Start free. You'll get all core features and 500 recordings monthly. Only upgrade when you need more.
4. FullStory
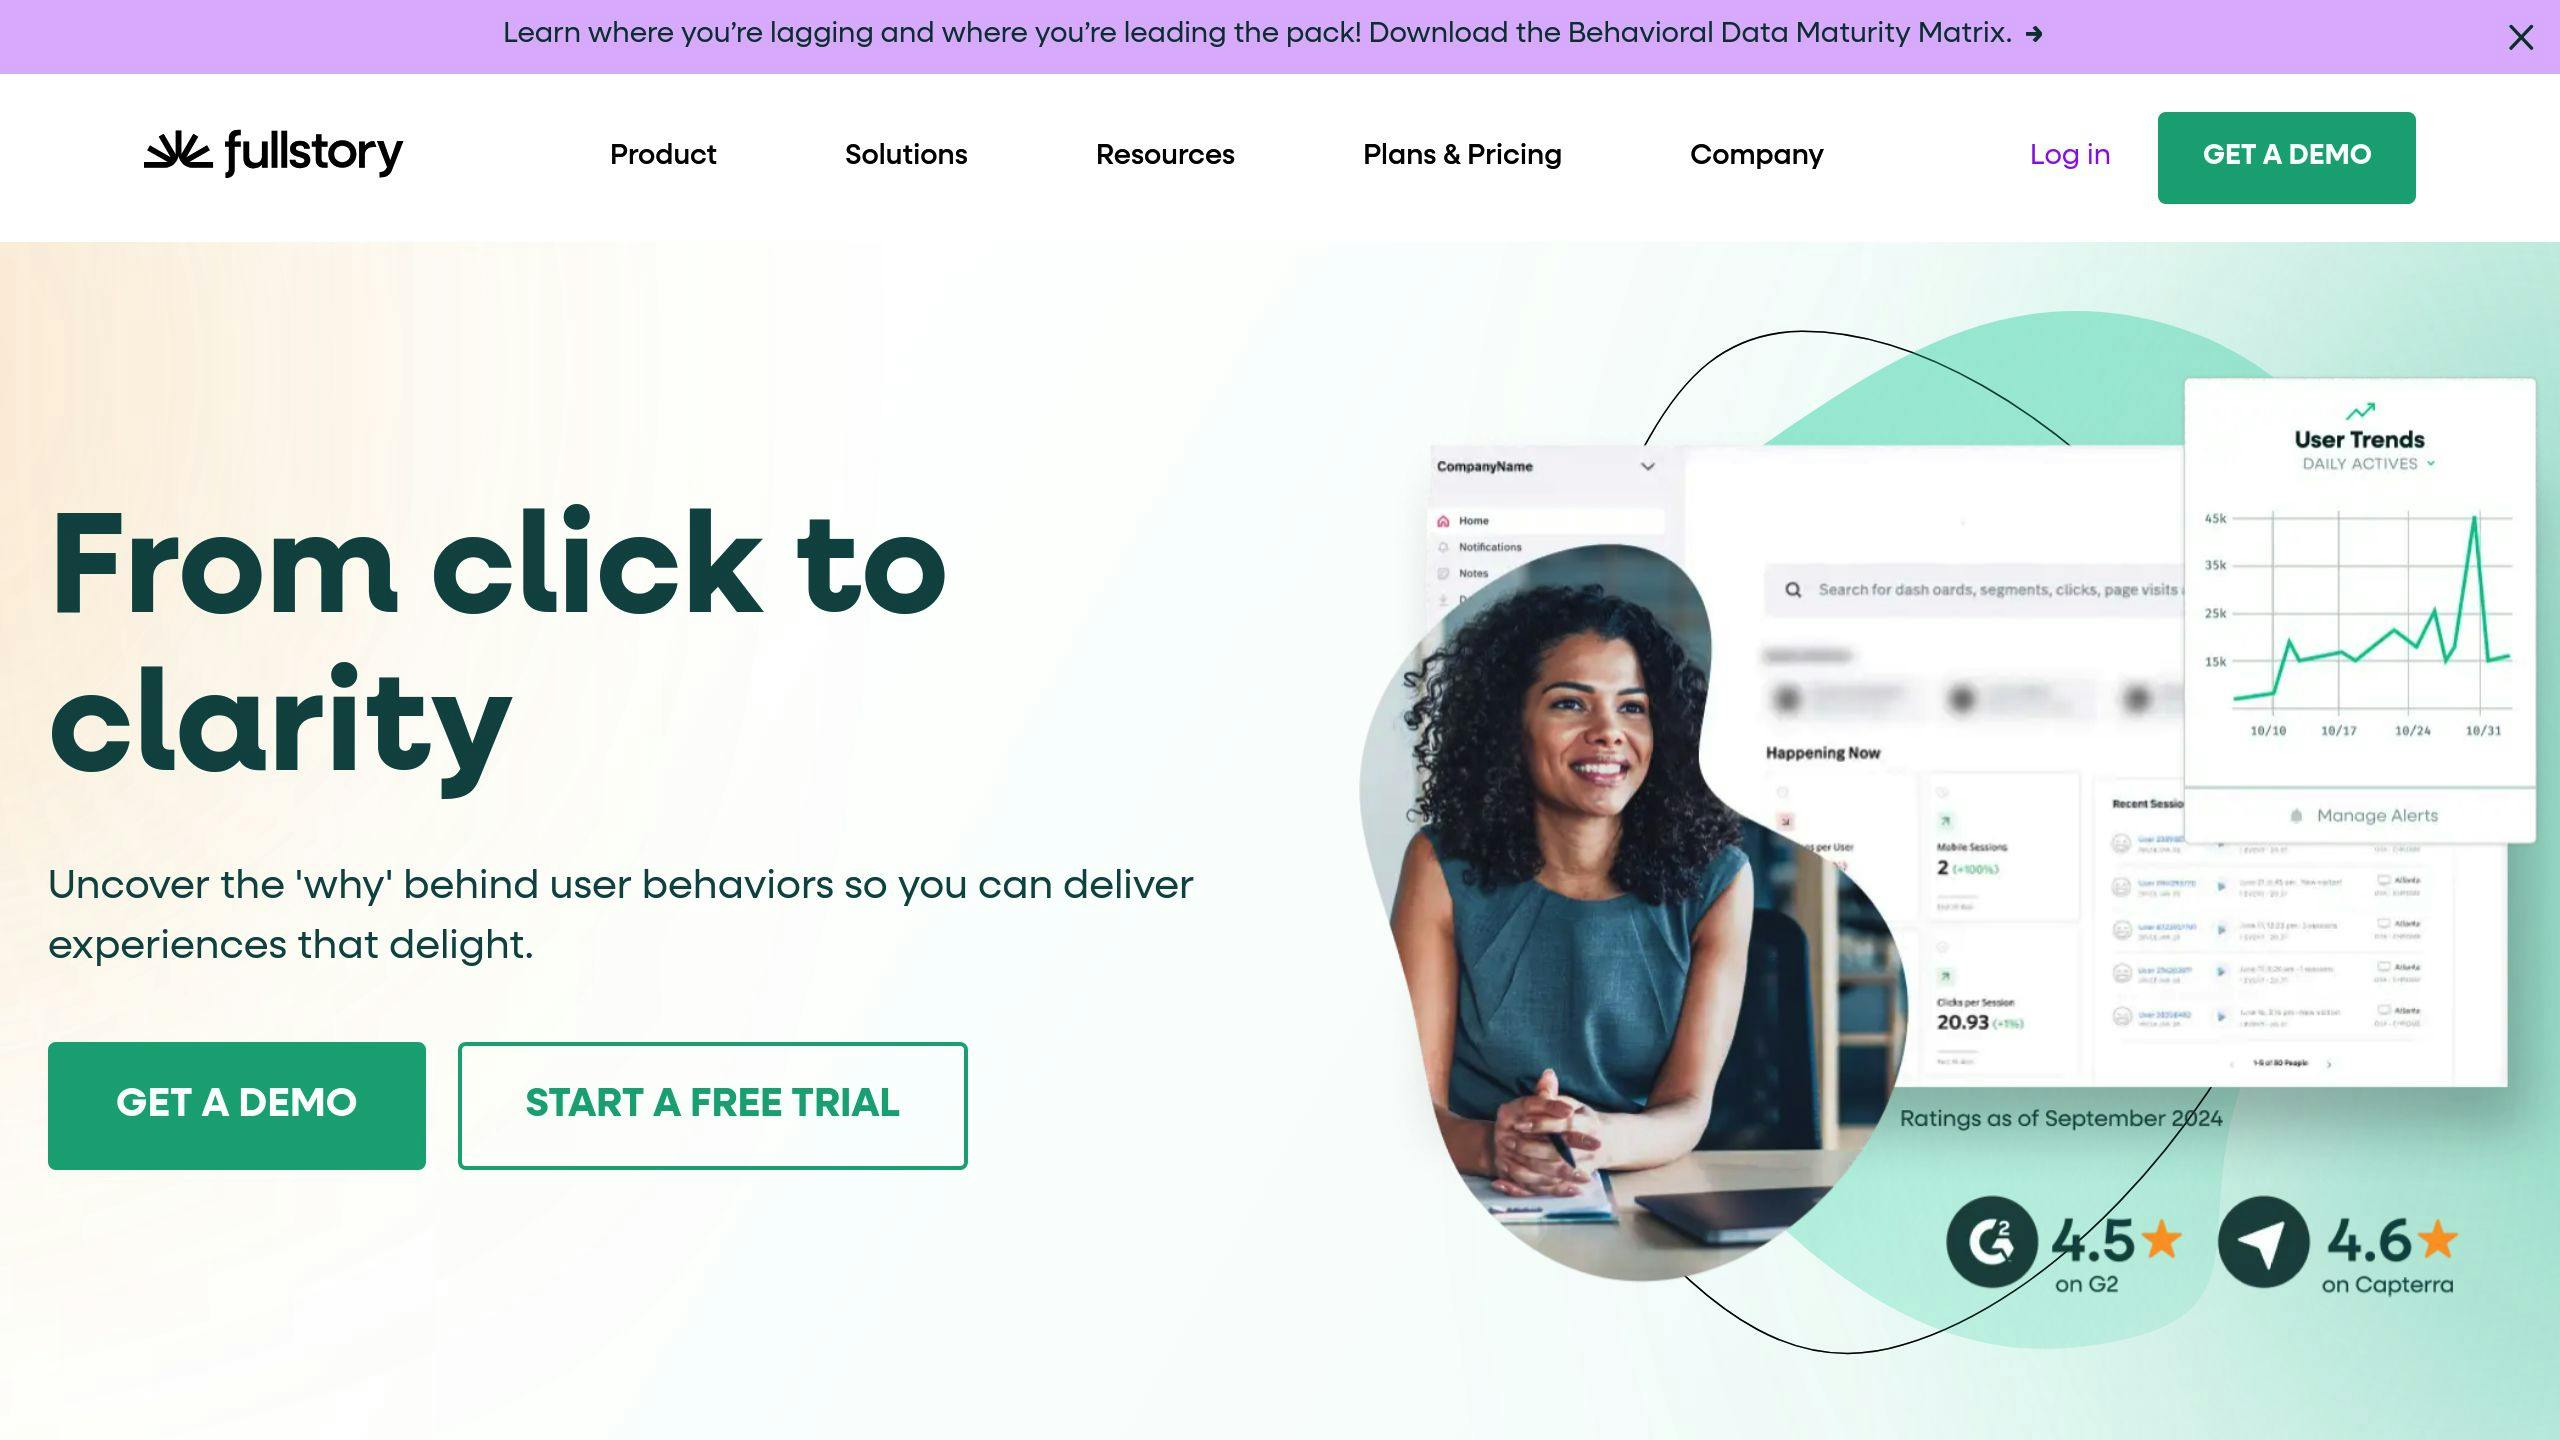
FullStory packs 8 different heatmaps into one platform:
| Heatmap Type | Purpose |
|---|---|
| Click Maps | Shows where users click or tap |
| Scroll Maps | Displays scroll depth patterns |
| Mouse-tracking | Tracks cursor movements |
| Eye-tracking | Maps visual attention areas |
| Error Click | Highlights failed interactions |
| Rage Click | Shows frustrated rapid clicking |
| Dead Click | Identifies non-responsive elements |
| AI-generated | Provides AI-based insights |
Here's what makes FullStory different: You can pause ANY session replay and see heatmap data for that exact moment. No extra setup. Just click and analyze.
Here's what it costs:
| Plan | Sessions/Month | Key Features |
|---|---|---|
| Free | 1,000 | Basic analytics, session replays |
| Business | 5,000 | Advanced analytics, full features |
| Advanced | Custom | Premium tools + Business features |
| Enterprise | Custom | Custom solutions, dedicated support |
Setting up takes 4 quick steps:
- Start your 14-day trial
- Drop the tracking code on your site
- Watch sessions and check heatmaps
- Use Page Insights while watching replays
"FullStory helps us spot user behavior patterns and find problems we didn't know existed." - Michelle Smith, Global Digital Analytics Manager, Fortive
What you get:
- Records everything without manual tags
- Keeps sensitive data private by default
- Works on Android and iOS
- Meets GDPR and SOC2 standards
- Includes MFA and SSO
FullStory fits medium and large businesses best, especially if you run an e-commerce site or SaaS platform. Small businesses might pause at the price - Enterprise plans can hit $50K per year.
Pro tip: Mix heatmaps with session replays. You'll spot problems faster and know if your design changes actually work.
5. Microsoft Clarity
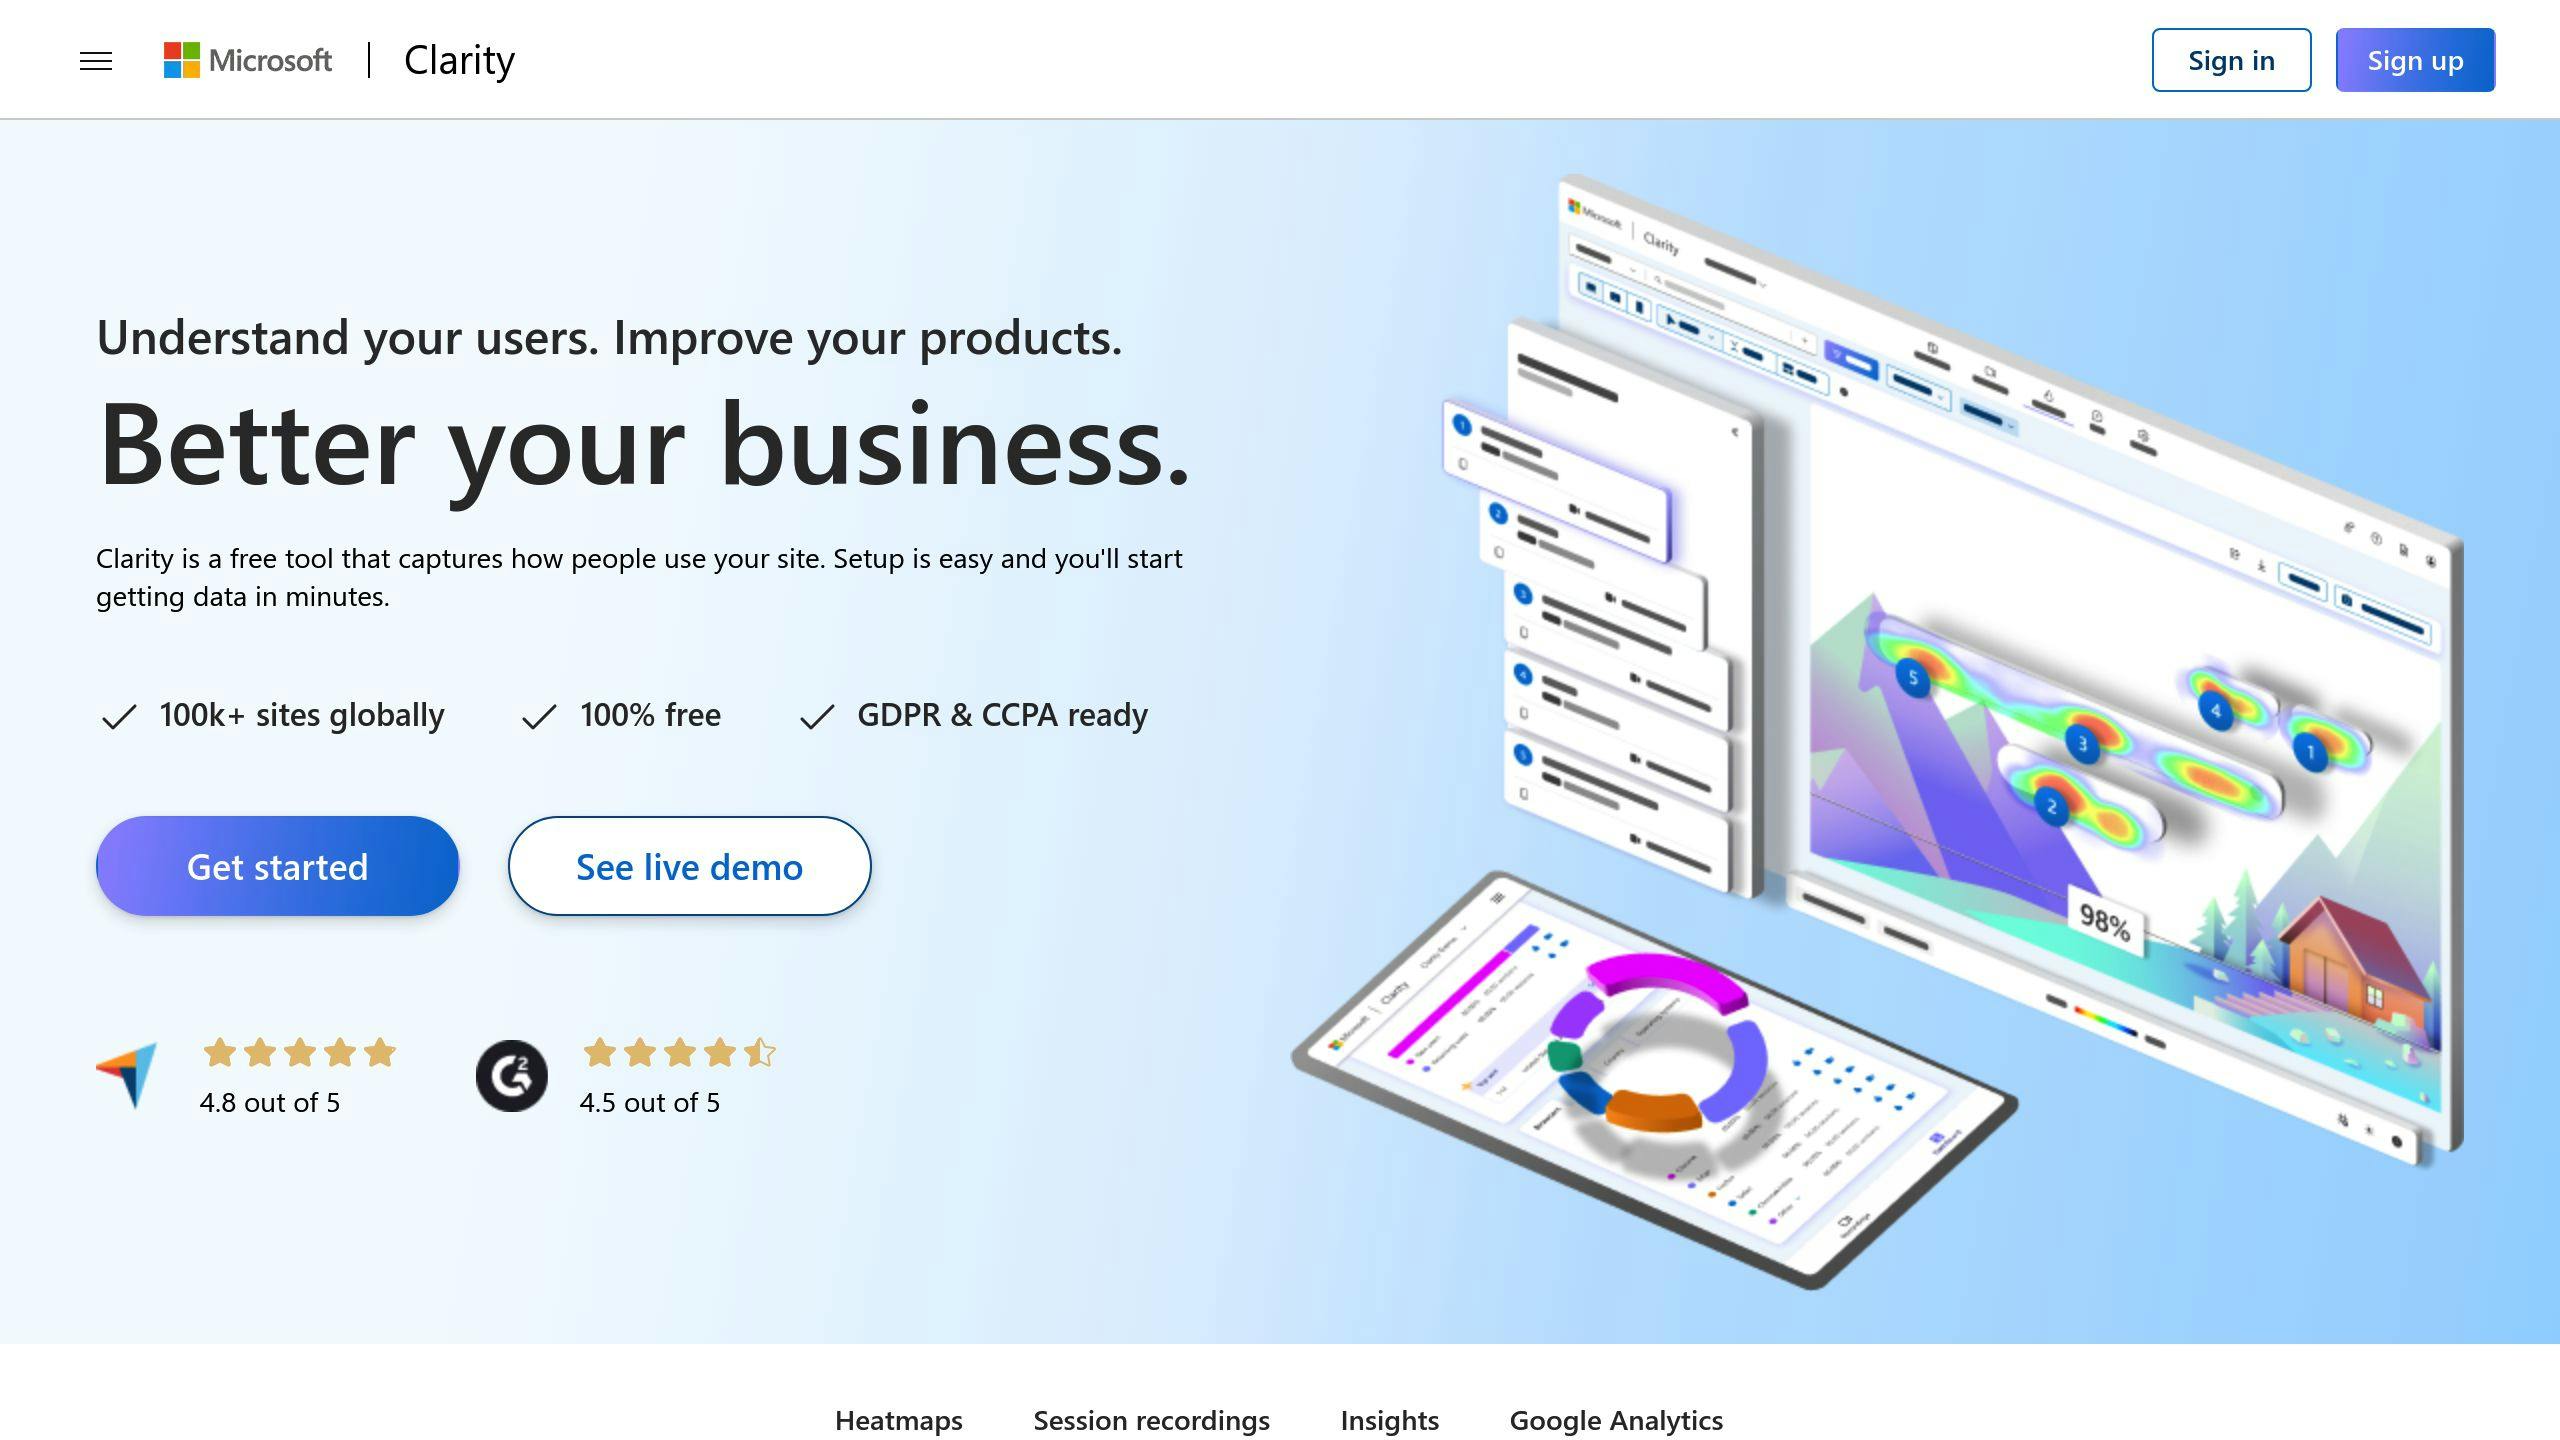
Microsoft Clarity offers a free plan with no traffic limits. Here's what you get:
| Feature Type | Details |
|---|---|
| Heatmap Types | Click, Scroll, Area |
| Data Retention | 30 days (recordings), 13 months (heatmaps) |
| Daily Limit | 100,000 sessions per project |
| Page Views | 100,000 per heatmap |
| Security | GDPR & CCPA ready |
Setting up is simple:
- Create account: Sign up for free
- Add project: Enter your site details
- Install code: Place tracking code in header
- Watch data: See results in 24-48 hours
The tool gives you three types of heatmaps:
| Heatmap | Purpose |
|---|---|
| Click | Shows where users click (and miss) |
| Scroll | Reveals scroll depth patterns |
| Area | Maps clicks by page regions |
You can view data by device type and run A/B tests by comparing heatmaps side-by-side.
"For a user experience analytics tool, I don't think you will find a better solution than what Microsoft has done with Clarity." - Scott Kivowitz, Chief Community Officer at Imagely
What Makes It Different:
- Heatmaps load instantly
- Shows heatmaps on live pages
- Links with Google Analytics
- Works on mobile apps
- Supports 100,000+ sessions daily
Over 100,000 websites use Clarity, from small blogs to big companies.
Quick Tip: Get the Clarity Live Chrome extension to track lazy-loaded content in your heatmaps.
sbb-itb-0e7f3ec
6. Lucky Orange
Lucky Orange combines heatmaps with 9 behavior tracking tools. Here's what you get:
| Feature | Details |
|---|---|
| Heatmap Types | Click, Scroll, Move |
| Data Storage | 30-60 days (based on plan) |
| Page Views | 500-300,000 per month |
| Security | GDPR & CCPA ready |
| Extra Tools | Session recording, live chat, surveys |
Pick your plan:
| Plan | Monthly Cost | Page Views |
|---|---|---|
| Free | $0 | 500 |
| Build | $14 | 10,000 |
| Grow | $28 | 40,000 |
| Expand | $58 | 100,000 |
| Scale | $128 | 300,000 |
What makes Lucky Orange different? It's built for real-world use:
- Heatmaps that work with dropdowns and popups
- Team-specific dashboards
- Smart live chat that responds to visitor behavior
- Form tracking to spot where users quit
- Conversion funnels to find where you lose sales
Getting started takes 4 steps:
- Pick a plan (free trial available)
- Add the tracking code
- Turn on your features
- Watch the data roll in
"The heat map, customer videos, and surveys helped us double our business in 2021." - Verified User, CRO Solutions
Works with:
- Shopify
- WordPress
- HubSpot
- Google Analytics
Over 400,000 websites use Lucky Orange. It's best for spotting user patterns, not fixing technical bugs.
Pro Tip: Add UTM parameters to see where your heatmap traffic comes from.
7. Contentsquare
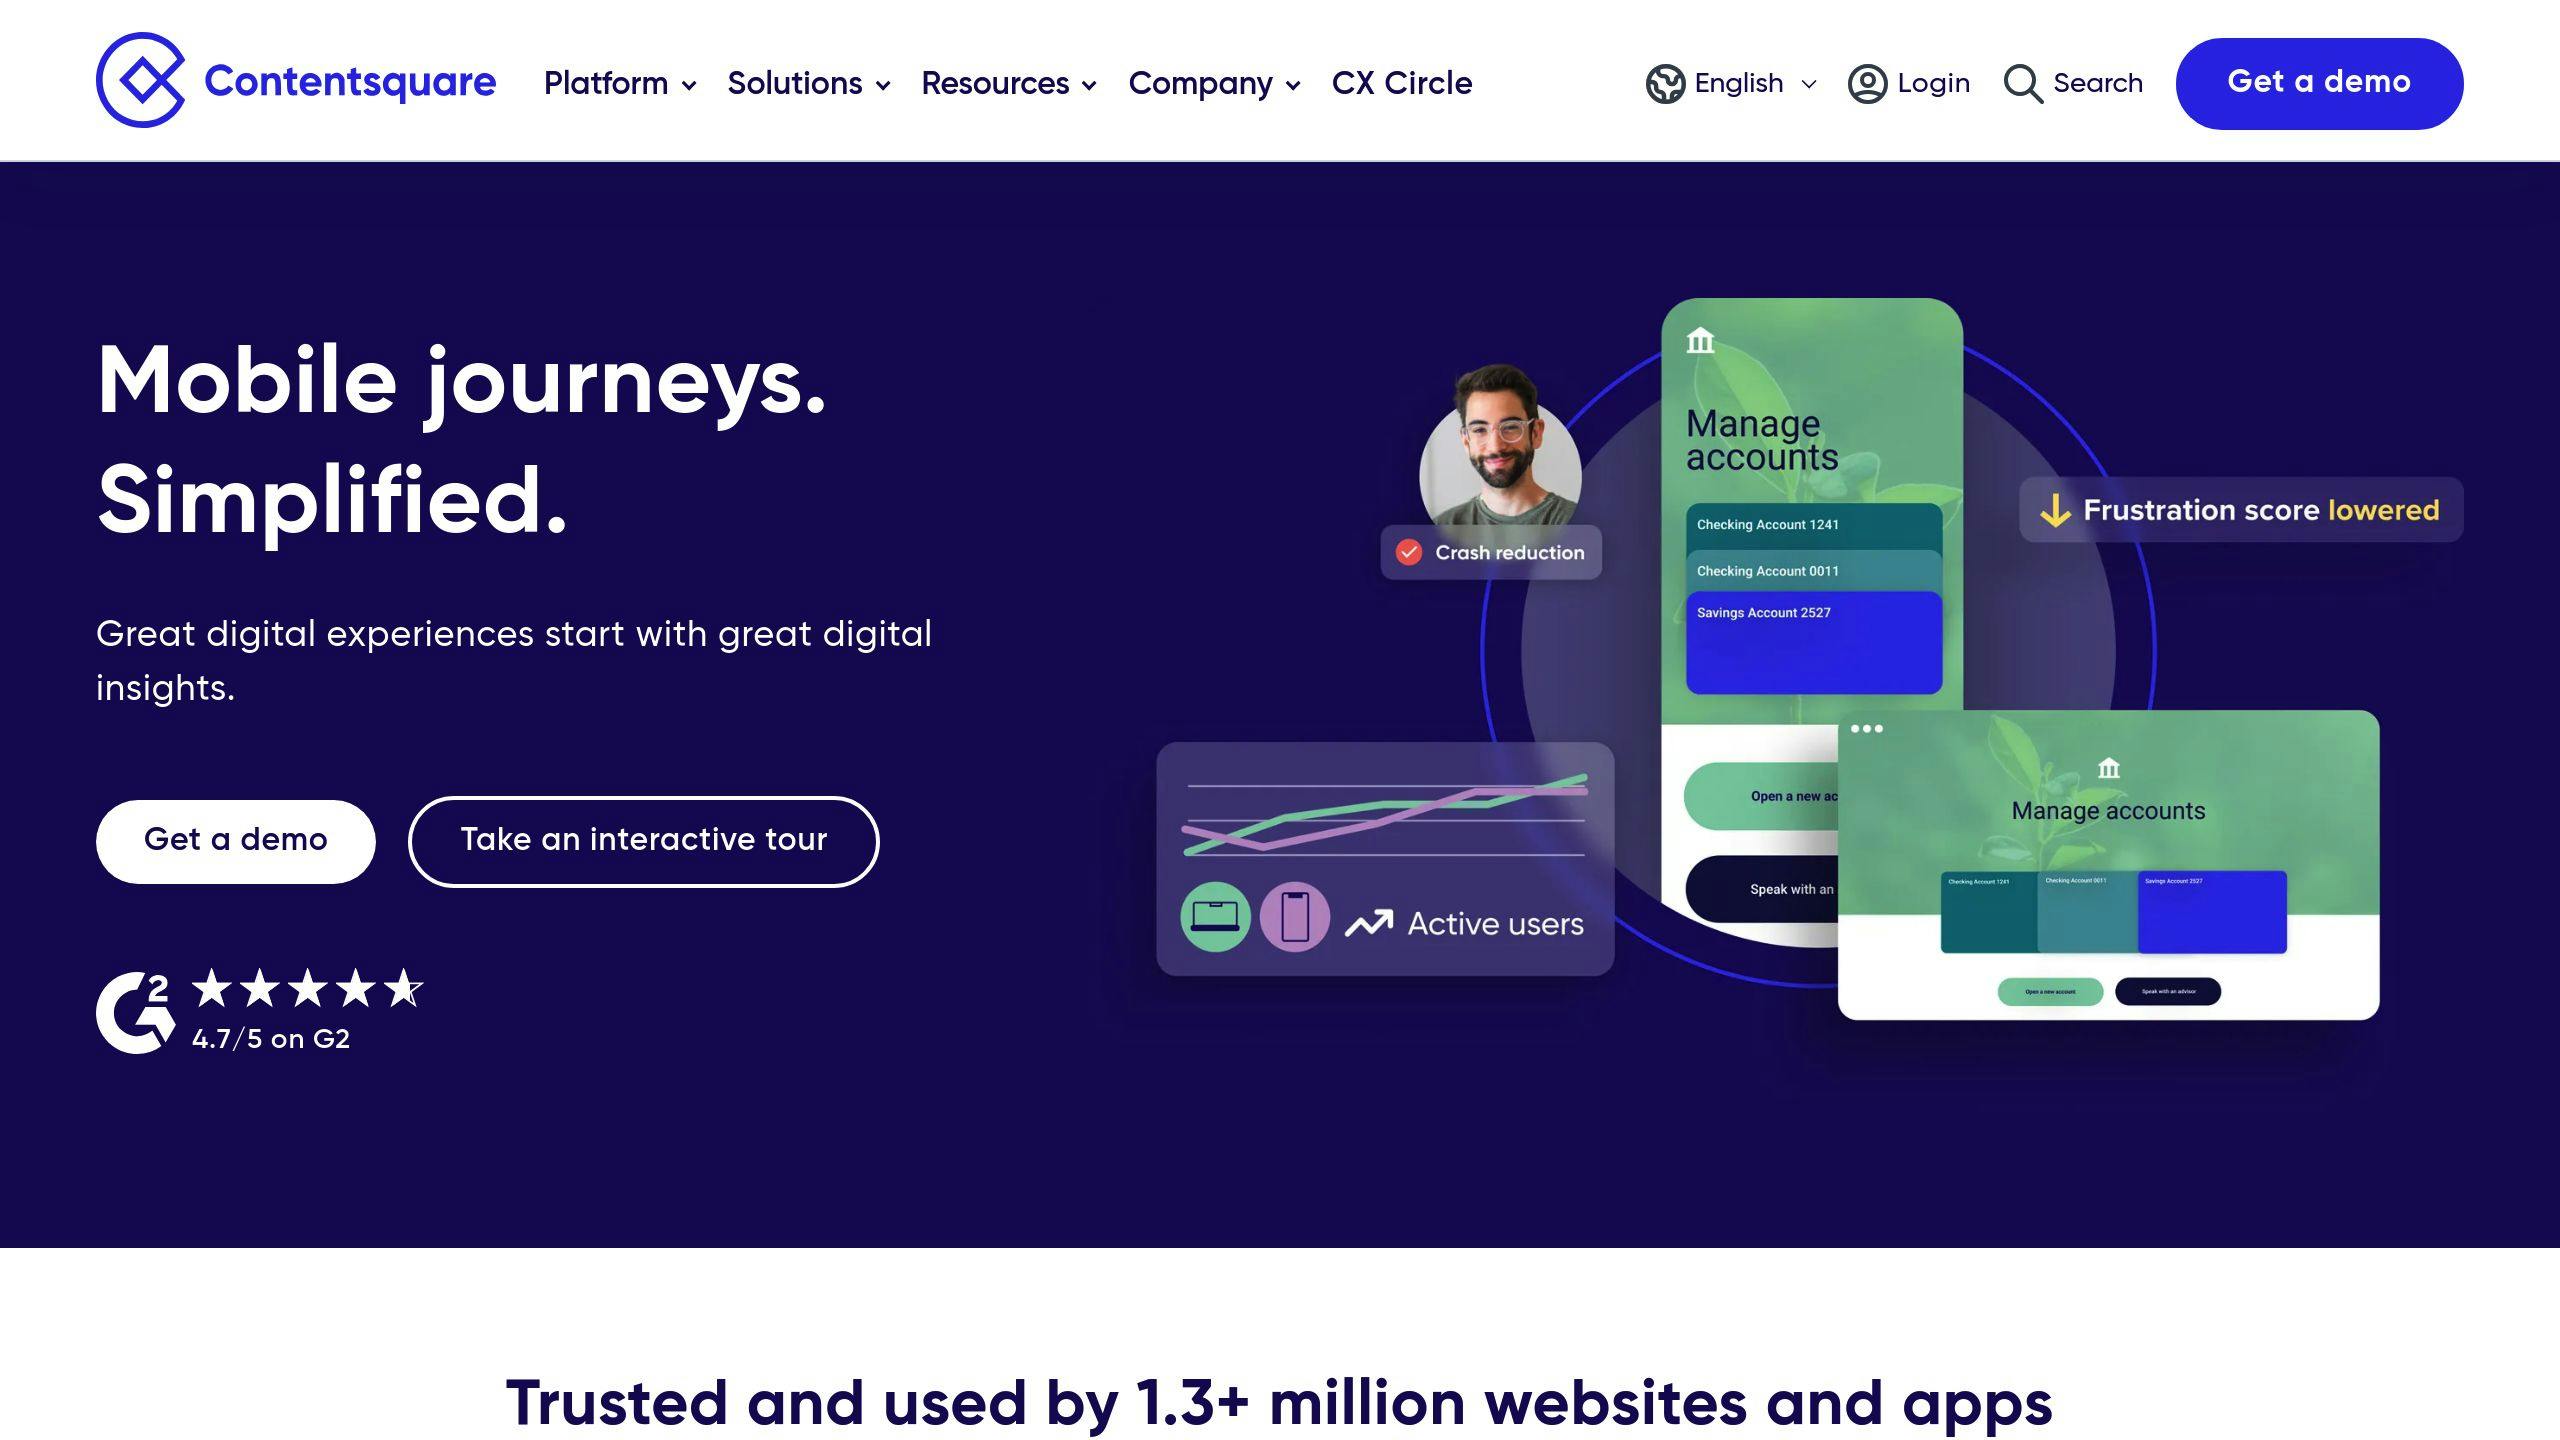
Contentsquare is an enterprise-level analytics platform that powers insights for major companies - including 30% of the Fortune Global 100. Here's what it does:
| Feature Type | Capabilities |
|---|---|
| Heatmap Analysis | Click tracking, scroll depth, mouse movement |
| Journey Analysis | Cross-session tracking, funnel analysis |
| Error Monitoring | Real-time alerts, speed analysis |
| Extra Tools | Form analysis, retention tracking, benchmarks |
Starting at $10,000 per month, it's built for big companies that need deep analytics.
| Tool Comparison | Contentsquare | Basic Heatmap Tools |
|---|---|---|
| Data Collection | Web + mobile apps + offline | Website only |
| Analysis Depth | Full customer journey | Single sessions |
| AI Features | Smart alerts, automated insights | Limited or none |
| Price Range | Custom enterprise pricing | $0-500/month |
The platform spots problems through:
- Heatmaps that show exactly where users click and scroll
- AI alerts that flag weird patterns
- Page speed and error tracking
- User journey mapping across devices
Getting started involves:
- Custom setup based on your needs
- Connecting your tools (GA360, Adobe Analytics)
- Team training
"Contentsquare shows insights in a way everyone can understand. We make decisions faster and don't miss sales opportunities because the data is so clear." - Lisa Skowrup, Senior Manager, Site Experience at The North Face
Works with:
- Google Analytics 360
- Salesforce Sales Cloud
- Adobe Analytics
- Custom API integrations
Quick Tip: Want better insights? Use the URL criteria dropdown to look at groups of pages instead of single URLs.
Support options:
- Live chat
- Phone
- Knowledge base
- Your own support rep (enterprise plans)
8. VWO

VWO's heatmap tool starts at $99/month as part of their testing platform. Here's what you get:
| Feature | Details |
|---|---|
| Heatmap Types | Click tracking, scroll depth, mouse movement, error clicks, rage clicks |
| Data Collection | Up to 100,000 clicks for test heatmaps, unlimited for standalone maps |
| Filtering Options | Device type, browser, geography, new vs. returning visitors |
| Security | Two-factor auth, multi-location data storage |
The numbers speak for themselves. Here's what companies achieved with VWO:
| Company | Action Taken | Result |
|---|---|---|
| IMB Bank | Analyzed low-performing pages | 36% conversion boost |
| Media Contour | Used funnel analysis | 15.63% conversion increase |
| Paltalk | Studied heatmaps + recordings | 57.32% ARPU uplift |
| BODYGUARDZ | Evaluated scroll patterns | 54% yearly revenue growth |
"VWO is much cheaper than the paid version of Optimize. It's just as full-featured at a significantly lower price." - Ernie DeCoite, VP, Digital Marketing, Becker
The tool comes packed with:
- Real-time data collection
- Desktop, mobile, and tablet tracking
- Team collaboration tools
- Point-and-click visual editor
Under the hood:
- Captures first 3 clicks per user
- Tracks up to 32,767 pixels from page top
- Samples visitor data
- Works with password-protected pages
Quick tips for better results:
- Add '?vwo_bo=1' to URLs for full-page heatmaps
- Use Command+Shift+2 (Mac) or Control+Shift+2 (Windows) for bottom bar
- Split reports by device type
- Look at both standalone and test heatmaps
VWO plays nice with WordPress, Magento, and Shopify. It turns complex user behavior into clear visual data, helping teams spot and fix issues fast.
What Works and What Doesn't
Let's break down each heatmap tool based on what users actually say about them:
| Tool | Strong Points | Limitations |
|---|---|---|
| Mouseflow | • 6 heatmap types (click, scroll, movement, attention, live, geo) • 100% traffic recording • Form analytics • Starting at $31/month |
• Mobile version updates slowly • Basic dashboard customization • Limited element list reports |
| Hotjar | • Click, scroll, and mouse movement maps • Direct session recording access • Survey builder with logic • From $32/month |
• Basic free plan • No predictive analytics • Limited data storage |
| Microsoft Clarity | • Free forever • Google Analytics integration • Click maps and scroll maps • Session recordings |
• Limited filtering options • Basic reporting features • No premium features |
| VWO | • Cross-device tracking • Unlimited heatmaps • Advanced segmentation • From $198/month |
• High starting price • Complex interface • Steep learning curve |
| Crazy Egg | • Clean interface • Multiple heatmap types • Side-by-side comparison • From $29/month |
• No free plan • Long load times • Basic UI for replays |
| Lucky Orange | • Real-time tracking • Deep segmentation • Dynamic heatmaps • From $19/month |
• Limited project management • Basic reporting tools • Small data storage |
| FullStory | • Unlimited heatmap analysis • Error click tracking • Detailed user paths • From $300/month |
• High price point • No scheduled heatmaps • Complex setup |
Here's what users think (based on ratings):
| Tool | Rating | Reviews | Platform |
|---|---|---|---|
| Mouseflow | 4.6/5 | 500+ | G2 |
| Hotjar | 4.7/5 | 500+ | Capterra |
| Microsoft Clarity | 4.5/5 | N/A | Capterra |
| VWO | 8.8/10 | 195 | TrustRadius |
| Crazy Egg | 4.2/5 | 100+ | G2 |
| Contentsquare | 8.8/10 | 79 | TrustRadius |
"VWO is much cheaper than the paid version of Optimize. It's just as full-featured at a significantly lower price." - Ernie DeCoite, VP, Digital Marketing, Becker
Here's what the data tells us:
- Microsoft Clarity DOMINATES the free tool space
- Hotjar and Mouseflow are the most user-friendly
- Big companies pick FullStory and VWO
- Small teams love Lucky Orange and Mouseflow
Pick your tool based on what you need:
| If You Need | Pick | Why |
|---|---|---|
| Basic Free Tool | Microsoft Clarity | No cost, core features |
| Team Collaboration | Hotjar | Built-in sharing tools |
| Enterprise Features | VWO | Advanced testing options |
| Budget Option | Lucky Orange | Low starting price |
| All-in-One Solution | Mouseflow | Complete feature set |
| Simple Interface | Crazy Egg | Clean, clear design |
Which Heatmap Tool Should You Pick?
Here's what you need to know about the top heatmap tools on the market:
| Business Type | Best Tool | Why It Fits | Monthly Cost |
|---|---|---|---|
| Small Business | Lucky Orange | Live tracking + core features | $19 |
| Startups | Mouseflow | Full feature set | $31 |
| Mid-size Companies | Hotjar | Team tools + surveys | $39 |
| Large Enterprise | VWO | Testing + analysis | $198 |
| Budget Option | Microsoft Clarity | Basic features | Free |
| Dev Teams | LogRocket | Debug + tech data | $69 |
Looking for something specific? Here's a breakdown:
| Need This | Use This | Main Feature | Price |
|---|---|---|---|
| Landing Pages | Zoho Pagesense | A/B testing | From $14/month |
| Simple Analysis | Plerdy | Easy interface | From $21/month |
| Live Data | Lucky Orange | Live tracking | From $32/month |
| AI Features | Zipy.ai | AI insights | From $39/month |
| Deep Data | Heatmap.com | Pro filters | From $89/month |
Let's break down your main options:
1. Free Option: Microsoft Clarity
What you get:
- Click and scroll maps
- Works with Google Analytics
- Full data (no sampling)
- Use on any number of sites
2. Best for Small Teams: Lucky Orange
What's included:
- See visitors in real-time
- Maps that update live
- Built-in chat
- Costs $19/month
3. Enterprise Pick: VWO
Key features:
- Track across devices
- No map limits
- Split visitors into groups
- Full testing tools
Here's what you get for your money:
| Tool | Monthly Sessions | How Long Data Stays | Cost Starts At |
|---|---|---|---|
| MouseStats | 15,000 | 30 days | $29 |
| FullSession | 5,000 | 90 days | $39 |
| Hotjar | 100 daily | 365 days | $39 |
| VWO | No limits | Your choice | $198 |
"VWO costs less than Optimize's paid version but matches its features" - Ernie DeCoite, VP, Digital Marketing, Becker
Save Money By:
- Starting with Microsoft Clarity (it's free)
- Going annual (save 15-20%)
- Matching your traffic needs
- Using free trials first
FAQs
How to analyze heatmap data?
Here's what to look for in your heatmap data:
| Key Question | Analysis Focus | Next Steps |
|---|---|---|
| Do users see important content? | Scroll depth + attention patterns | Move key content up if scroll rates are low |
| How do CTAs perform? | Button click patterns | Adjust CTA placement or design for low clicks |
| What confuses users? | Clicks on non-clickable elements | Make buttons more obvious or remove misleading elements |
| What grabs attention? | Clicks in non-priority areas | Cut elements that pull focus from main CTAs |
| How do devices differ? | Desktop vs mobile behavior | Fix specific device layout issues |
Want accurate data? Wait until you hit 2,000+ visitors. And don't mix your analysis - look at desktop and mobile separately, and focus on one page type at a time.
But here's the thing: heatmaps are just ONE piece of the puzzle.
You'll need other tools too:
| Tool | What You'll Learn |
|---|---|
| Session recordings | How people navigate your site |
| Analytics | Hard data on user actions |
| A/B testing | What changes actually work |
| User surveys | Direct user feedback |
By combining these tools, you'll understand both WHAT users do and WHY they do it.
Pro tip: Always compare your "before" and "after" data when making changes. That's how you'll know if your updates actually helped.
