Want to know exactly how people use your website? Here are the 15 best heatmap tools that show where visitors click, scroll, and get stuck:
| Tool | Starting Price | Best For |
|---|---|---|
| Hotjar | $39/month | Small-medium businesses |
| CrazyEgg | $99/month | A/B testing focus |
| Mouseflow | $39/month | Deep behavior tracking |
| Lucky Orange | $32/month | Live chat + heatmaps |
| VWO | $48/month | Enterprise testing |
| Microsoft Clarity | Free | Basic tracking |
| Smartlook | $55/month | Mobile app analysis |
| FullStory | Custom | Large enterprises |
| Inspectlet | $39/month | Form analytics |
| Browsee | $49/month | AI-powered insights |
| Attention Insight | $21/month | AI predictions |
| Zoho PageSense | $19/month | Budget-friendly |
| FigPii | $49/month | Conversion focus |
| CROTools | Custom | Testing suites |
| Plerdy | $23/month | Basic tracking |
Quick Comparison:
| Feature | Free Tools | Paid Tools | Enterprise Tools |
|---|---|---|---|
| Monthly Sessions | 1,000-5,000 | 10,000-100,000 | Unlimited |
| Data Storage | 30 days | 90 days | 1+ year |
| Click Maps | ✓ | ✓ | ✓ |
| Scroll Maps | ✓ | ✓ | ✓ |
| Session Recording | Basic | Full | Advanced |
| Form Analytics | × | ✓ | ✓ |
| API Access | × | Limited | Full |
| Support | Chat/Email | Dedicated |
Bottom Line: If you're just starting, try Microsoft Clarity (it's free). For serious business use, Hotjar or CrazyEgg give you the most bang for your buck. Enterprise? Look at FullStory or VWO.
Related video from YouTube
What Are Heatmaps?
Heatmaps work like thermal cameras for your website. They use colors to show where users click, scroll, and move - red means lots of action, blue means little to none.
Let's break down the main heatmap types:
| Type | What It Shows | Key Use Cases |
|---|---|---|
| Click Maps | User clicks and taps | Find popular buttons, dead links |
| Scroll Maps | Reading depth | Spot where users stop reading |
| Mouse Movement | Cursor paths | See what grabs attention |
| Error Click | Failed clicks | Find broken elements |
| Rage Click | Frustrated clicking | Spot annoying features |
Here's a REAL example of heatmaps in action:
Sainsbury's used click maps and found something big: 48% of customers bounced after hitting delivery options. By fixing this ONE issue, they made an extra $200,000 per quarter.
Want to know something cool? Mouse movement actually shows where people look. Users move their cursor where their eyes go - giving you eye-tracking data without the fancy equipment.
Here's what the colors tell you:
| Color | Activity | Meaning |
|---|---|---|
| Red/White | High | Major hotspot |
| Orange/Yellow | Medium | Some interest |
| Blue/Green | Low | Ignored area |
But here's the thing: Mobile and desktop users behave differently. With 45.49% of US traffic coming from phones, you need BOTH views to get the full picture.
Smart ways to use heatmaps:
- Test if your buttons work
- Check if people see important stuff
- Find scroll drop-off points
- Spot what's broken
- Compare different layouts
The best part? You can pair heatmaps with A/B tests. This combo shows exactly how your changes affect user behavior - no more guessing what works.
How We Picked These Tools
We tested and scored each heatmap tool using 6 key factors:
| Factor | Weight | What We Checked |
|---|---|---|
| Core Features | 25% | Click maps, scroll maps, movement tracking |
| Extra Features | 25% | A/B testing, session replay, analytics integration |
| Setup & Use | 20% | Installation time, interface clarity |
| Support | 10% | Response times, help resources |
| Price Value | 10% | Cost vs features offered |
| User Reviews | 10% | Real customer feedback |
Each tool needed these basic features:
- Click, scroll, and mouse tracking
- Mobile and desktop views
- Data filtering
- Basic reporting
- GDPR compliance
The best tools also included:
- Session recordings
- Form analysis
- API access
- Custom events
- Advanced segmentation
Here's what different plans typically cost:
| Plan Level | Monthly Cost | Pages You Can Track |
|---|---|---|
| Free | $0 | 1-3 pages |
| Basic | $29-49 | Up to 10 pages |
| Pro | $79-99 | Up to 50 pages |
| Business | $150+ | Unlimited pages |
We made sure each tool:
- Works with Google Analytics, Tag Manager, WordPress, Shopify
- Handles dynamic content and single-page apps
- Loads fast (under 0.5 seconds added to page load)
- Tracks password-protected pages
- Works on all screen sizes
For data accuracy, we checked if tools could:
- Track elements correctly
- Remove bot traffic
- Handle changing URLs
- Show exact click spots
- Update data instantly
The top performers let you:
- Share reports with your team
- Get raw data exports
- Pick specific date ranges
- Look at different time periods
- Break down traffic by source
Hotjar
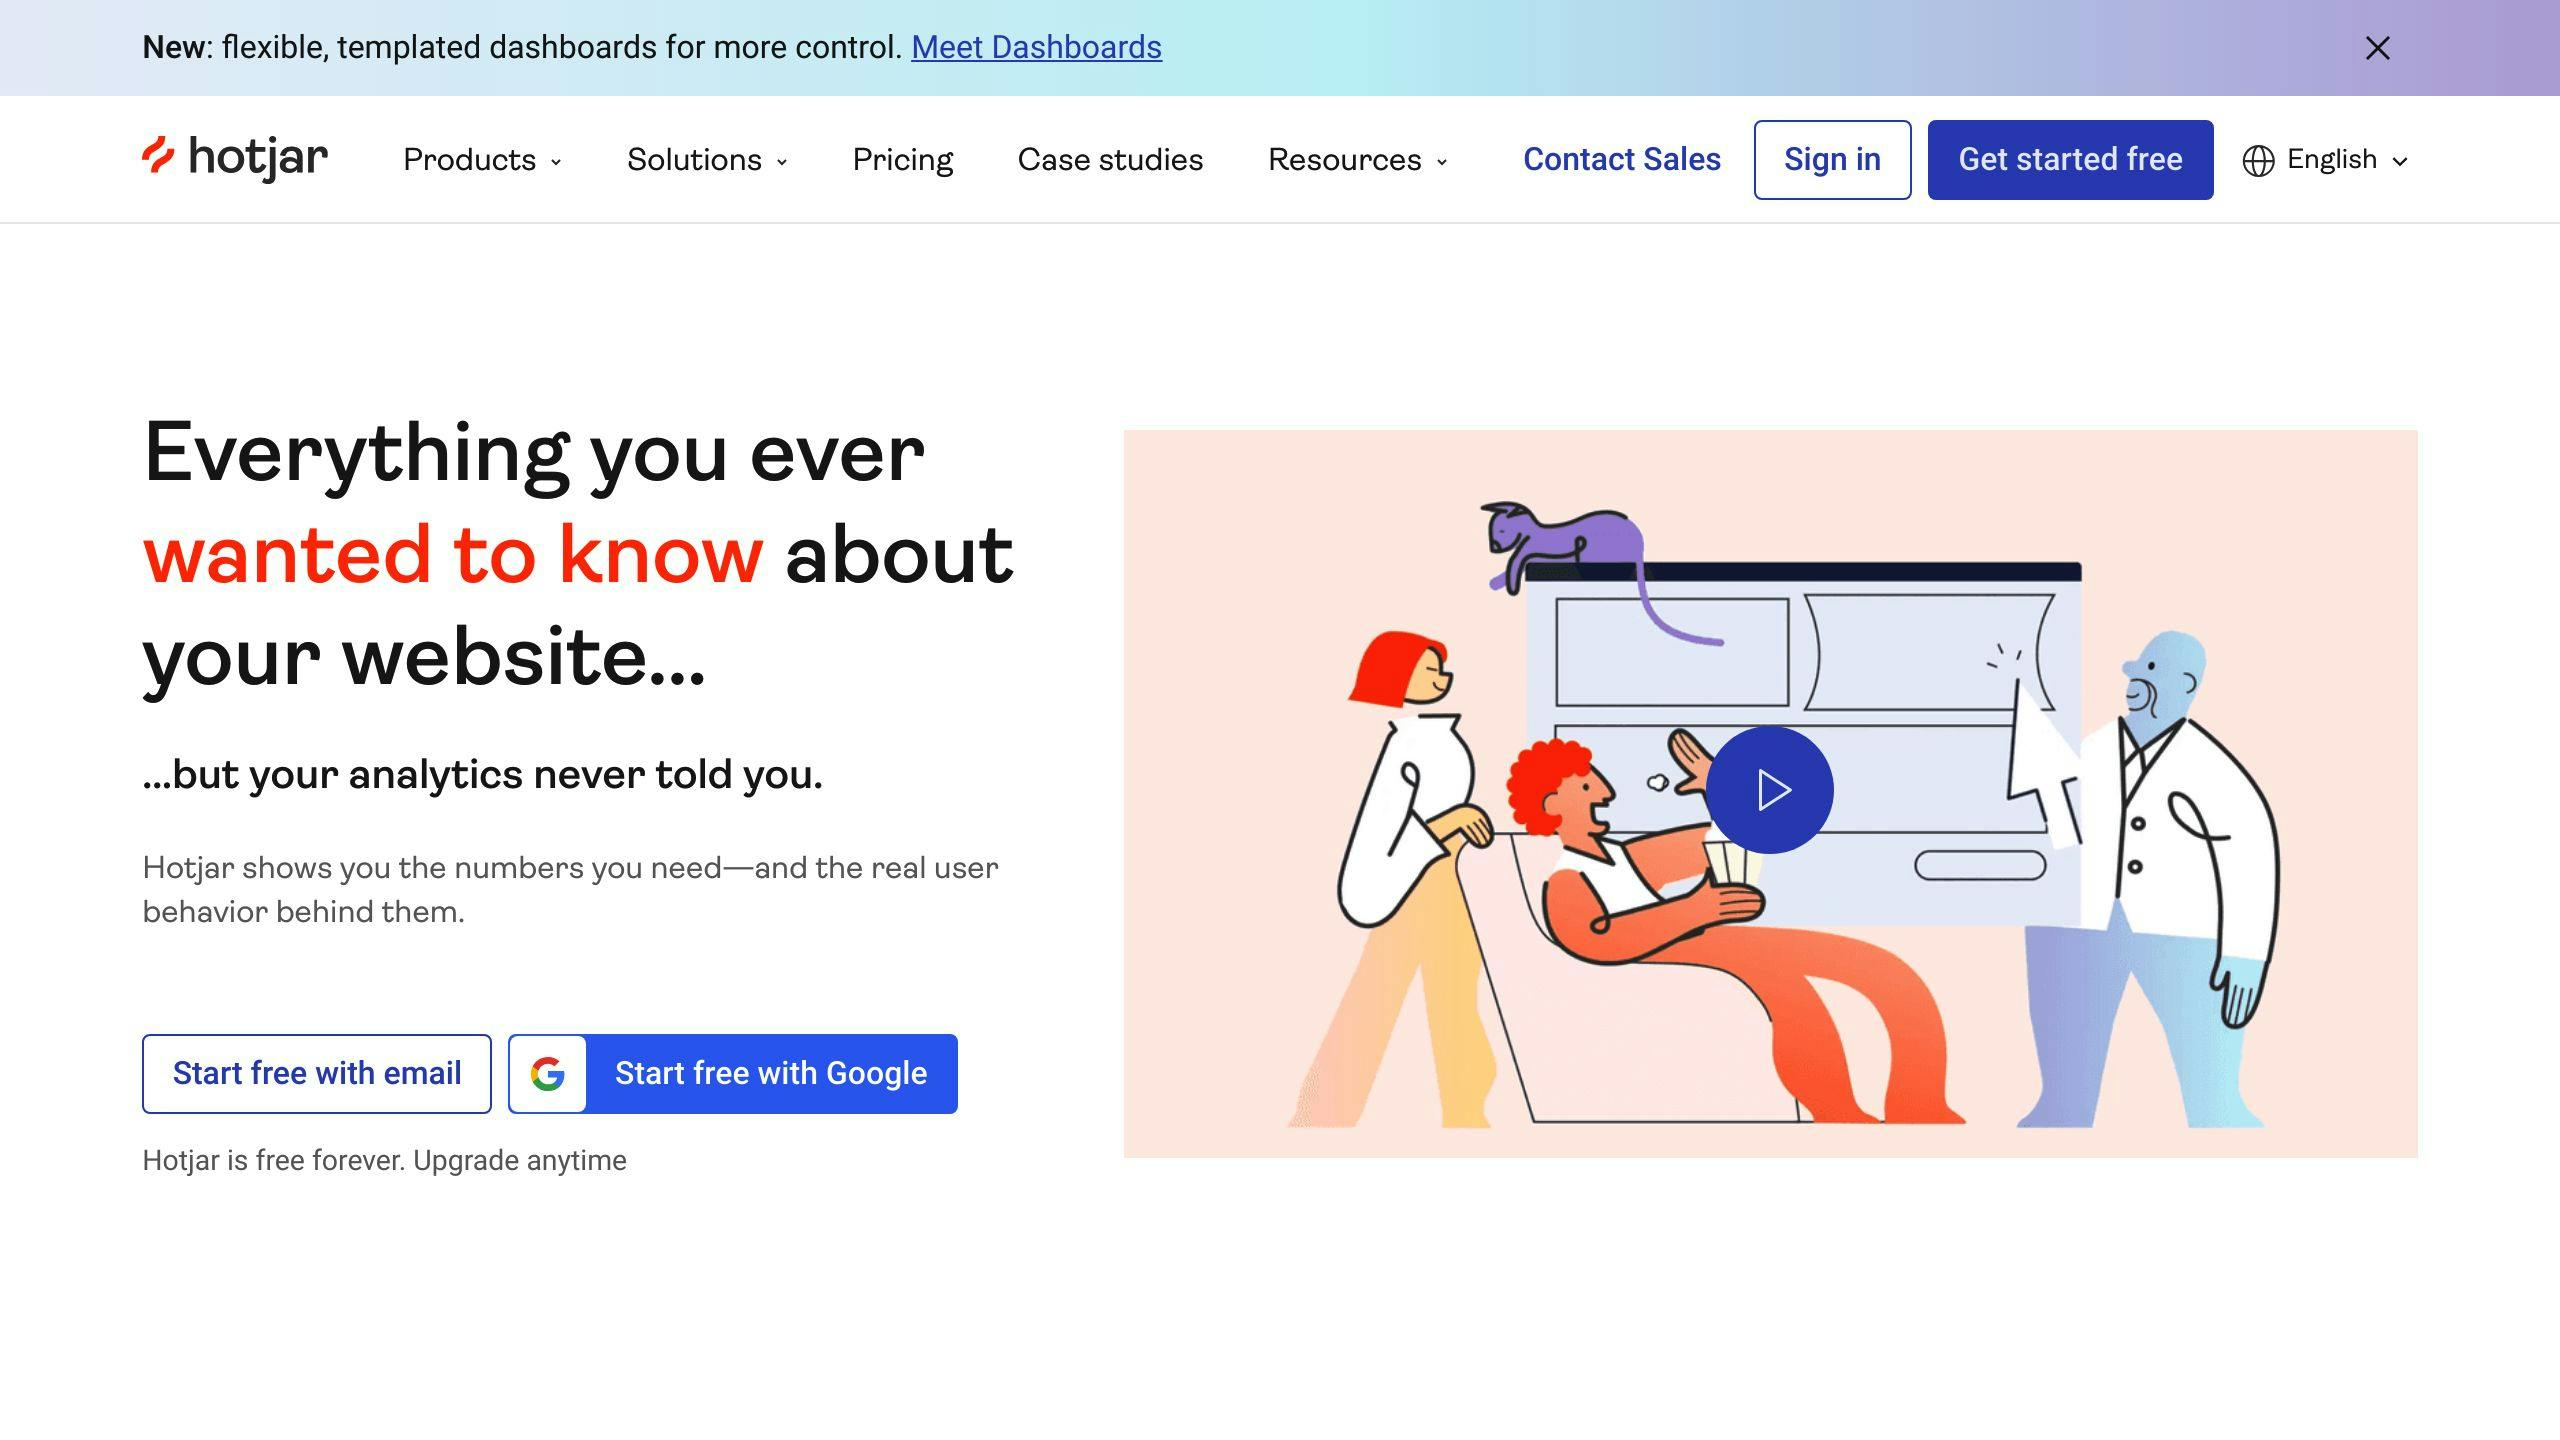
Hotjar is a heatmap tool that powers over 900,000 websites, including big names like IKEA, Panasonic, and Nintendo. Here's what you get:
| Feature Category | What You Get |
|---|---|
| Core Tracking | - Unlimited heatmaps - Click, scroll, and move maps - Session recordings up to 365 days - Rage click detection |
| Data Collection | - 35 daily sessions (free plan) - Up to 270,000 daily sessions (scale plan) - Direct Google Analytics integration |
| Feedback Tools | - Surveys and polls - User interviews - Form analysis |
| Technical Specs | - 10-minute installation - First-party cookies - GDPR compliance |
Want to know how much it costs? Here's the breakdown:
| Plan Type | Monthly Cost | Key Features |
|---|---|---|
| Free | $0 | 35 daily sessions, basic heatmaps |
| Plus | $39 | 100 daily sessions, data filtering |
| Business | $99 | 500 daily sessions, API access |
| Scale | $213 | Custom session limits, all features |
The tool connects with platforms you're already using:
- WordPress
- Google Analytics
- Optimizely
- HubSpot
- Slack
- Microsoft Teams
- 50+ other platforms
Here's what makes Hotjar's data tracking solid:
- Filters out bot traffic
- Updates in real-time
- Works across all devices
- Tracks custom events
- Captures data automatically
Setting up is FAST - 67% of users get the tracking code running in under 10 minutes. Plus, it uses first-party cookies for better accuracy and privacy.
Need more power? The advanced features include:
- API access
- Funnel analysis
- Auto-reporting
- Team tools
- Data exports
You'll get help through docs and a ticket system (1-2 day response). Scale plan? You also get a dedicated success manager.
2. CrazyEgg
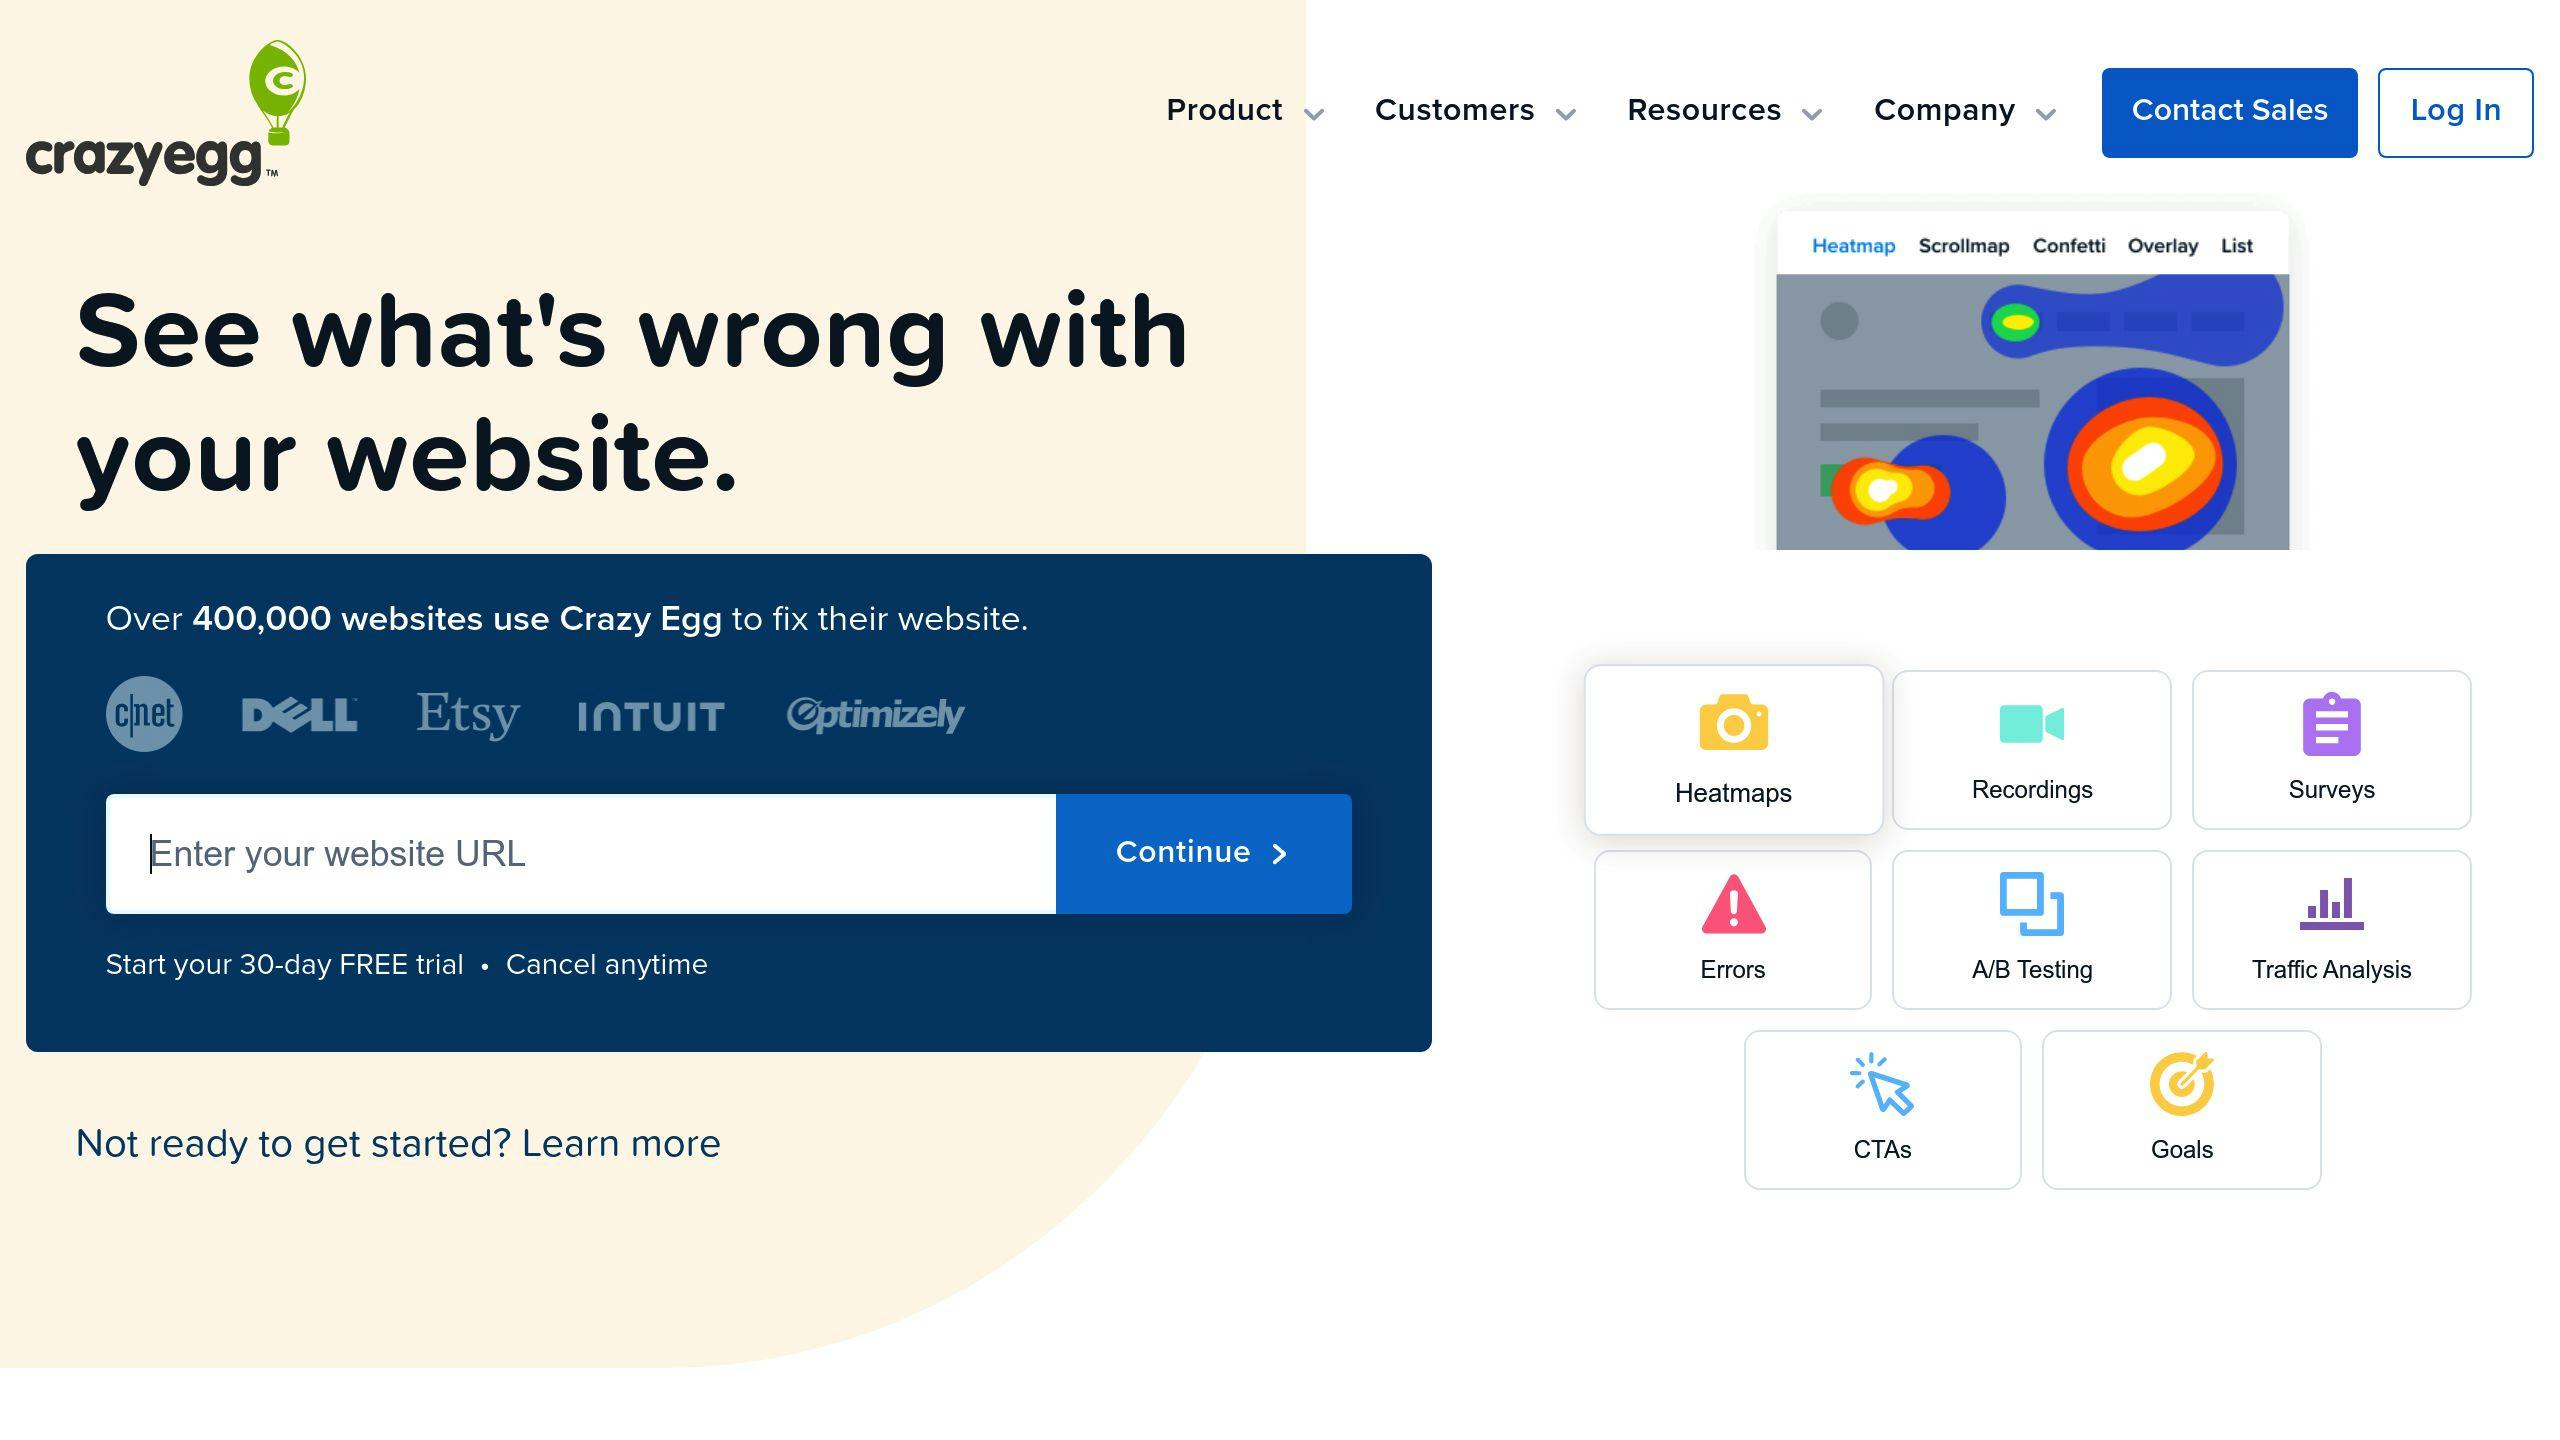
CrazyEgg helps you see exactly how people use your website. Here's what you get:
| Feature Category | What You Get |
|---|---|
| Core Features | - Click heatmaps - Scroll maps - Hover maps - Session recordings - A/B testing |
| Data Collection | - Real-time visitor tracking - Device-specific maps - Traffic source analysis - Custom event tracking |
| Feedback Tools | - User surveys - Error tracking - Customer feedback forms |
| Technical Setup | - 60-day free trial - Quick code installation - First-party tracking |
The tool connects with popular platforms like:
- Shopify
- WordPress
- Wix
- AWeber
- Google Analytics
Want to know what CrazyEgg shows you? Here's the breakdown:
| Report Type | What It Shows |
|---|---|
| Clickmaps | Where users click on your pages |
| Scrollmaps | How far visitors scroll down |
| Confetti | Clicks by traffic source and device |
| List Reports | Click data in spreadsheet format |
| Snapshots | Single-page engagement metrics |
"If you haven't used a tool like Crazy Egg in the past, you're about to be blown away. The data that you can get from this tool is crazy helpful and a little scary! You can use the heatmap data to adjust content, landing pages, conversion funnels, and so much more." - Chris C, Director of Operations at Lead Gen Agency
Here's Proof It Works: WallMonkeys tested their homepage with CrazyEgg's A/B testing tool. The changes they made led to a 550% boost in conversions.
CrazyEgg helps you find problems through:
- Click pattern analysis
- User session playback
- Error tracking
- Traffic source data
- Behavior flow mapping
Need help? You'll get:
- Online documentation
- Email support
- Video tutorials
- Setup guides
3. Mouseflow

Mouseflow helps you see exactly how visitors use your website through heatmaps and behavior tracking. Here's what makes it different:
| Feature Type | Capabilities |
|---|---|
| Heatmap Types | - Click and hover tracking - Scroll depth data - Mouse movements - Visitor locations - Attention spots - Live maps |
| Session Tools | - Full page navigation - Form analytics - Error catching - Custom filters |
| Data Collection | - Team sharing - Live tracking - Data filtering - GDPR ready |
Want to know what your visitors actually do? Here's what each heatmap shows you:
| Heatmap Type | What It Shows |
|---|---|
| Scroll Maps | How far people scroll down |
| Click Maps | Where people click most |
| Movement Maps | Where mice move |
| Geographic Maps | Where visitors come from |
| Attention Maps | What content gets read |
How Much It Costs:
| Plan | Monthly Cost | What You Get |
|---|---|---|
| Starter | $31 | 5,000 recordings, 3-month storage |
| Growth | $109 | More recordings + storage |
| Business | $219 | Advanced tools + team access |
| Pro | $399 | Everything + priority help |
| Enterprise | Custom | Built for your needs |
What You Can Do:
- Watch visitors move between pages
- See how people watch YouTube videos
- Check form success rates
- Spot JavaScript problems
- Make your own visitor surveys
People LOVE it - 4.7/5 stars from 680 users, with 68.1% giving 5 stars.
This tool helps you:
- Fix conversion problems
- Make forms work better
- Watch visitors in real-time
- See if content works
- Check if buttons get clicked
How It Stores Data:
- HTML Local Storage
- HTTP Cookies
- IndexedDB for bigger data
- Both short and long-term tracking
4. Lucky Orange
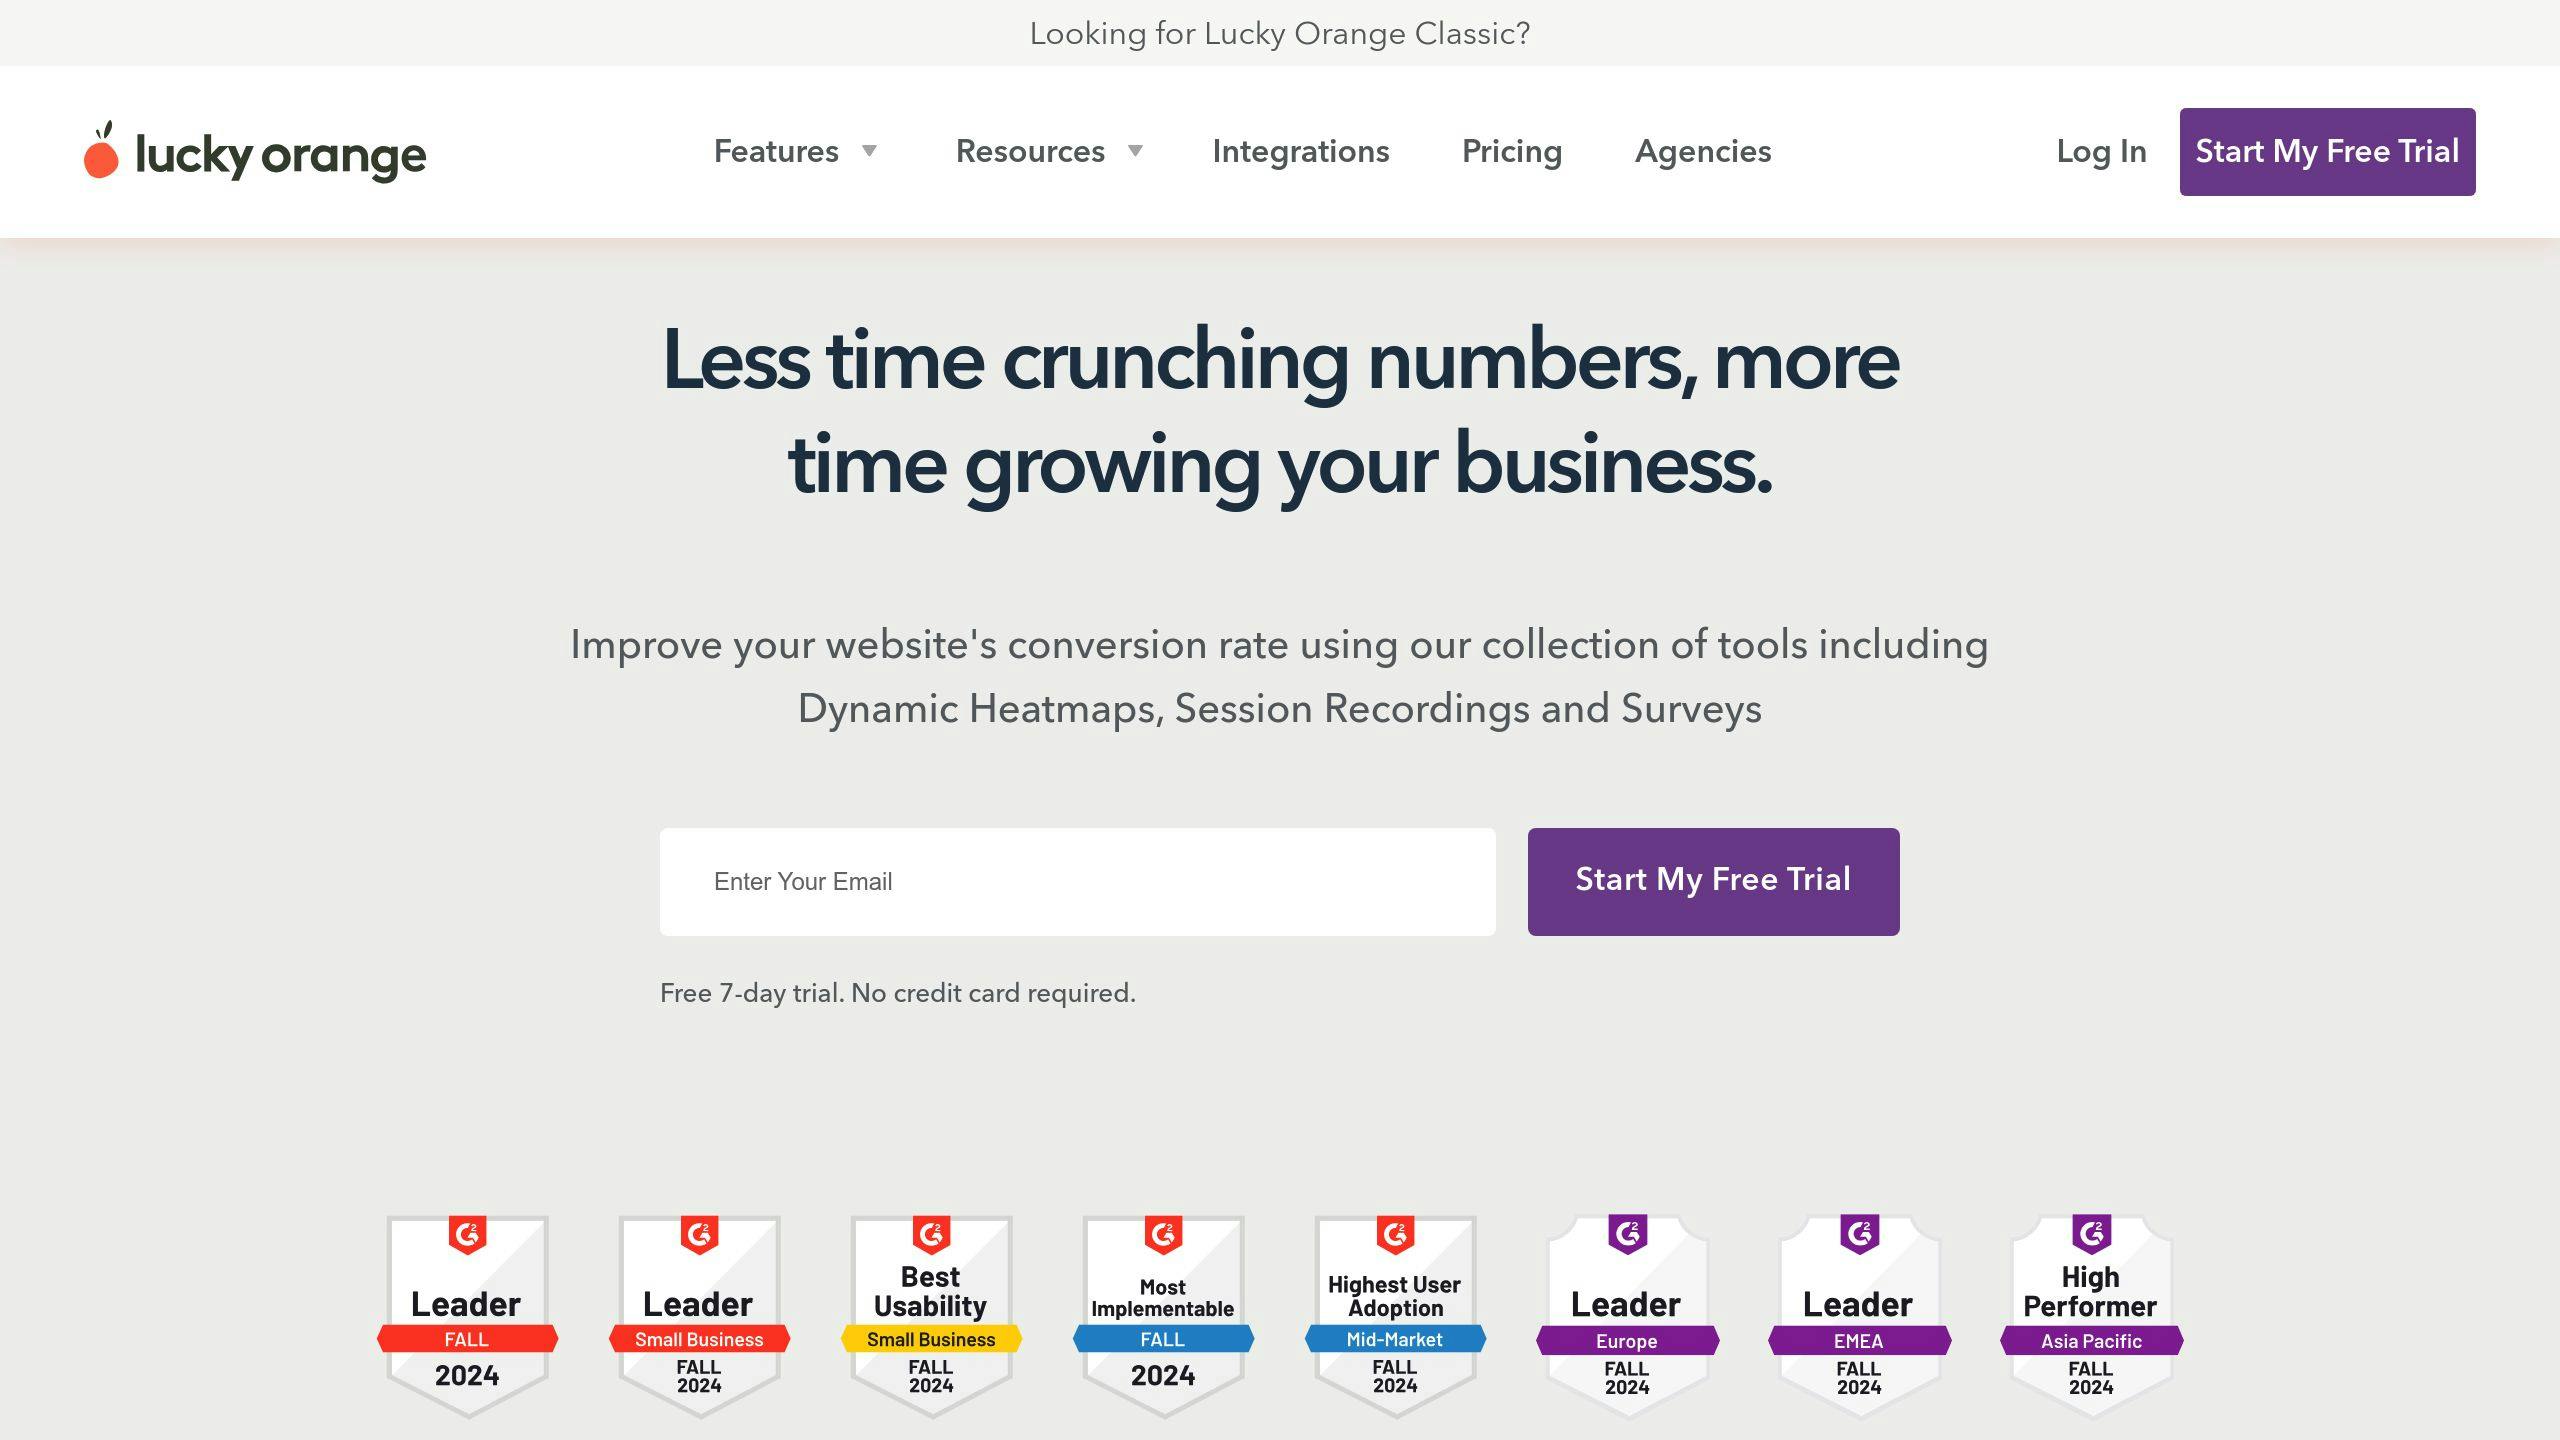
Lucky Orange shows you exactly how people use your website. With heatmaps, recordings, and live chat, it helps you spot and fix issues fast. Here's what 500,000+ websites already know:
| Feature Type | What You Get |
|---|---|
| Heatmap Tools | - Dynamic heatmaps that work on all devices - Click tracking - Scroll depth analysis - Mouse movement maps - Form interaction data |
| User Analysis | - Live visitor recordings - Conversion funnels - Form analytics - Custom polls - Chat support |
| Data Storage | - 30-60 days of recordings - GDPR & CCPA ready - Anonymous tracking options |
Here's what makes Lucky Orange different:
| Feature | How It Works |
|---|---|
| Dynamic Heatmaps | See changes as they happen, even on menus |
| Session Playback | Watch every move your visitors make |
| Form Tracking | Find out why people abandon your forms |
| Live Chat | Chat with visitors while watching their screen |
| Visitor Profiles | See each visitor's complete journey |
Pick your plan:
| Plan | Price | Page Views |
|---|---|---|
| Free | $0 | 500 |
| Build | $14 | 10,000 |
| Grow | $28 | 40,000 |
| Expand | $58 | 100,000 |
| Scale | $128 | 300,000 |
"When you see how people ACTUALLY use your site, you can fix what's broken and boost conversions." - Sarah Bond, Sr. Director of Marketing Strategy at Lucky Orange
Why people pick Lucky Orange:
- Heatmaps update in real-time
- Watch and chat with visitors at once
- Works with pop-ups and dynamic elements
- Every team member gets access
- All plans include every integration
With a 4.6/5 rating from 103 G2 reviews, Lucky Orange works best when you need quick insights about your website visitors.
5. VWO

VWO's heatmap tools show you how people use your website. Here's what makes it different:
| Feature Type | Capabilities |
|---|---|
| Heatmap Types | - Dynamic heatmaps track live changes - Click maps show where users click - Scroll maps reveal content viewing patterns - Element lists display engagement stats |
| Data Collection | - Tracks popup interactions - Monitors login pages - Works with changing URLs - Covers all devices (desktop/mobile/tablet) |
| Filtering Options | - 20+ ready-to-use filters - First-time vs repeat visitors - Device types - Location data - Custom filters |
Here's what companies achieved with VWO:
| Company | What They Did | Results |
|---|---|---|
| IMB Bank | Fixed poor-performing pages | +36% conversions |
| Media Contour | Analyzed user paths | +15.63% conversions |
| Qualicorp | Made forms easier | +16.93% sign-ups |
| Paltalk | Made UX simpler | +57.32% more revenue per user |
| BODYGUARDZ | Used scroll data to redesign | +54% yearly revenue |
"VWO makes everything simple - from running tests to watching customer behavior. It helps us spot sales problems, track user journeys, and test how people use our site." - Loef Kleinmeijer, ISM eCompany
Team tools that matter:
| Feature | What It Does |
|---|---|
| Custom Views | Bookmark important page sections |
| Collaboration | Comment directly on heatmaps |
| Security | 2FA and user permissions |
| Data Storage | Multi-region storage + encryption |
| Support | Direct customer help |
VWO works best when you need to:
- See how users interact with dynamic content
- Look at specific visitor groups
- Work with your team on insights
- Handle multiple tests
- Keep your data safe
Plans start free with 20 monthly responses. Paid options begin at €48.00 for 250 monthly responses.
6. Microsoft Clarity
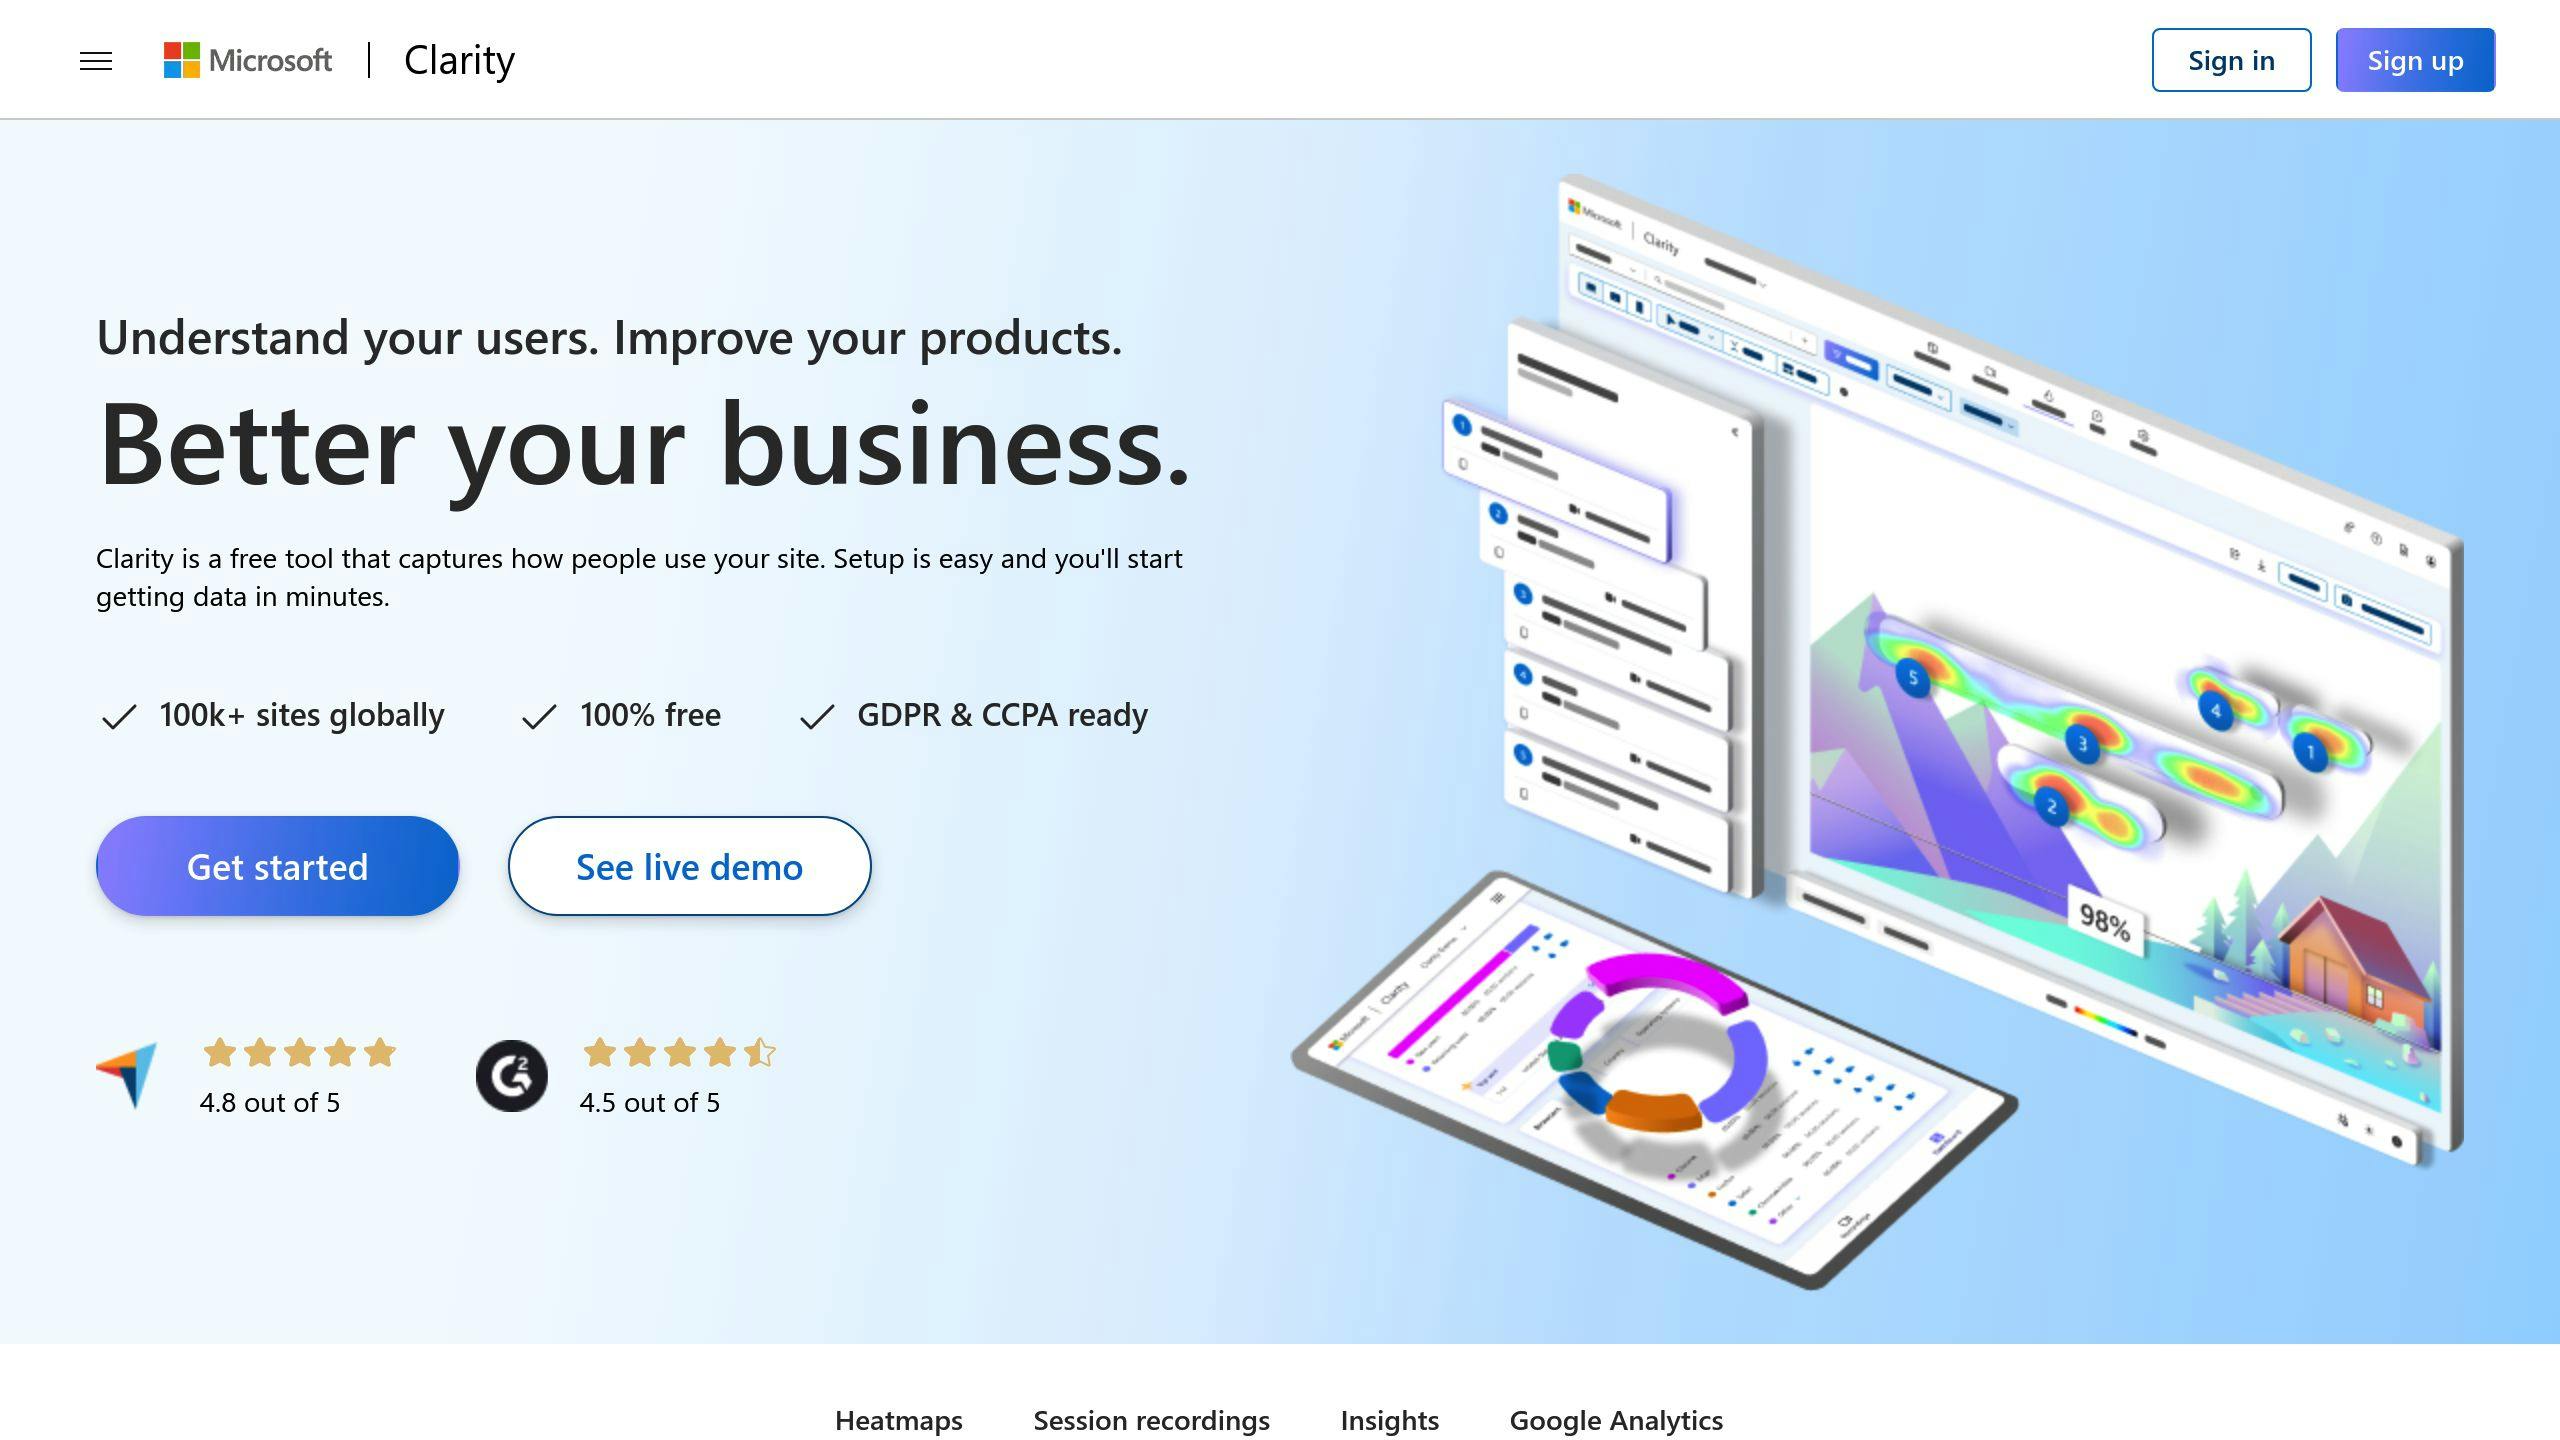
Microsoft Clarity is a free heatmap tool that lets you track unlimited website traffic. Here's what you get:
| Feature Category | Capabilities |
|---|---|
| Heatmap Types | - Click maps to see where users click - Scroll depth tracking - Area maps for content engagement - Rage click detection - Conversion path analysis |
| Data Collection | - 100,000 page views per heatmap - 13 months of heatmap storage - 30 days of recordings - Zero traffic sampling |
| Integration Options | - Google Tag Manager - Shopify plugin - WordPress plugin - Webflow support - Mobile apps (Android, React Native) |
Here's the technical stuff you need to know:
| Aspect | Details |
|---|---|
| Data Retention | - Heatmaps: 13 months - Session recordings: 30 days - Saved recordings: 13 months |
| Daily Limits | - 100,000 sessions per project - 100,000 page views per heatmap |
| Security & Privacy | - GDPR & CCPA ready - Data encryption - No Do Not Track support |
| Filtering Options | - RegEx support - Custom user segments - Device type filters - Location filters |
"Clarity for Android helps us see exactly how users interact with our app. It's changed how we improve engagement and conversion. Now it's a key part of our workflow." - AbdelRahman el Naka, Marketing Manager at Robusta
| Pros | Limitations |
|---|---|
| Free without traffic limits | Basic sharing features |
| Easy setup | No guaranteed support |
| Browser extensions | No A/B testing |
| Mobile app tracking | No feedback tools |
| Quick heatmap creation | No dynamic sections |
Microsoft Clarity fits best for:
- Teams who need basic heatmaps
- High-traffic websites
- Zero-budget projects
- Mobile app tracking
- Basic user behavior analysis
Price: 100% free
7. Smartlook

Smartlook combines heatmaps, session recordings, and funnel analysis into one tool that works for both websites and mobile apps.
| Feature Category | Capabilities |
|---|---|
| Heatmap Types | - Click tracking for static elements - Move heatmaps - Scroll depth analysis - Mobile app heatmaps - Historical data support |
| Data Collection | - 10+ sessions per heatmap - Simple URL matching - Exact URL matching - Substring URL matching - Cross-platform tracking |
| Integration Options | - 50+ tool integrations - Zapier support - iOS SDK - Android SDK - React Native SDK |
Here's what makes Smartlook different:
| Aspect | Details |
|---|---|
| Platform Support | - Websites - iOS apps - Android apps - React Native - Flutter - Unity - Unreal Engine |
| Event Tracking | - Automatic event capture - No-code event picker - Custom event definition - Rage click detection - JavaScript error tracking |
| Analysis Tools | - Funnel analysis - Session recordings - Anomaly detection - Conversion tracking - Drop-off analysis |
"Smartlook is a game changer for mobile app analytics. With advanced features like funnels, we're able to see if we need to adjust our UX or if anything went wrong during implementation." - Alžběta Husáková, Marketing manager at Fitify
| Pros | Limitations |
|---|---|
| Mobile app support | Limited dynamic element tracking |
| Automatic event tracking | Complex funnel setup |
| Historical data access | Basic heatmap features |
| Cross-platform analysis | Higher starting price |
| Funnel anomaly alerts | Limited free plan |
Smartlook fits best for:
- Mobile app developers
- Cross-platform projects
- Teams who want automatic tracking
- Conversion optimization
- Bug detection workflows
Price: Starts free, paid plans from $69/month for 5,000 sessions
8. Fullstory
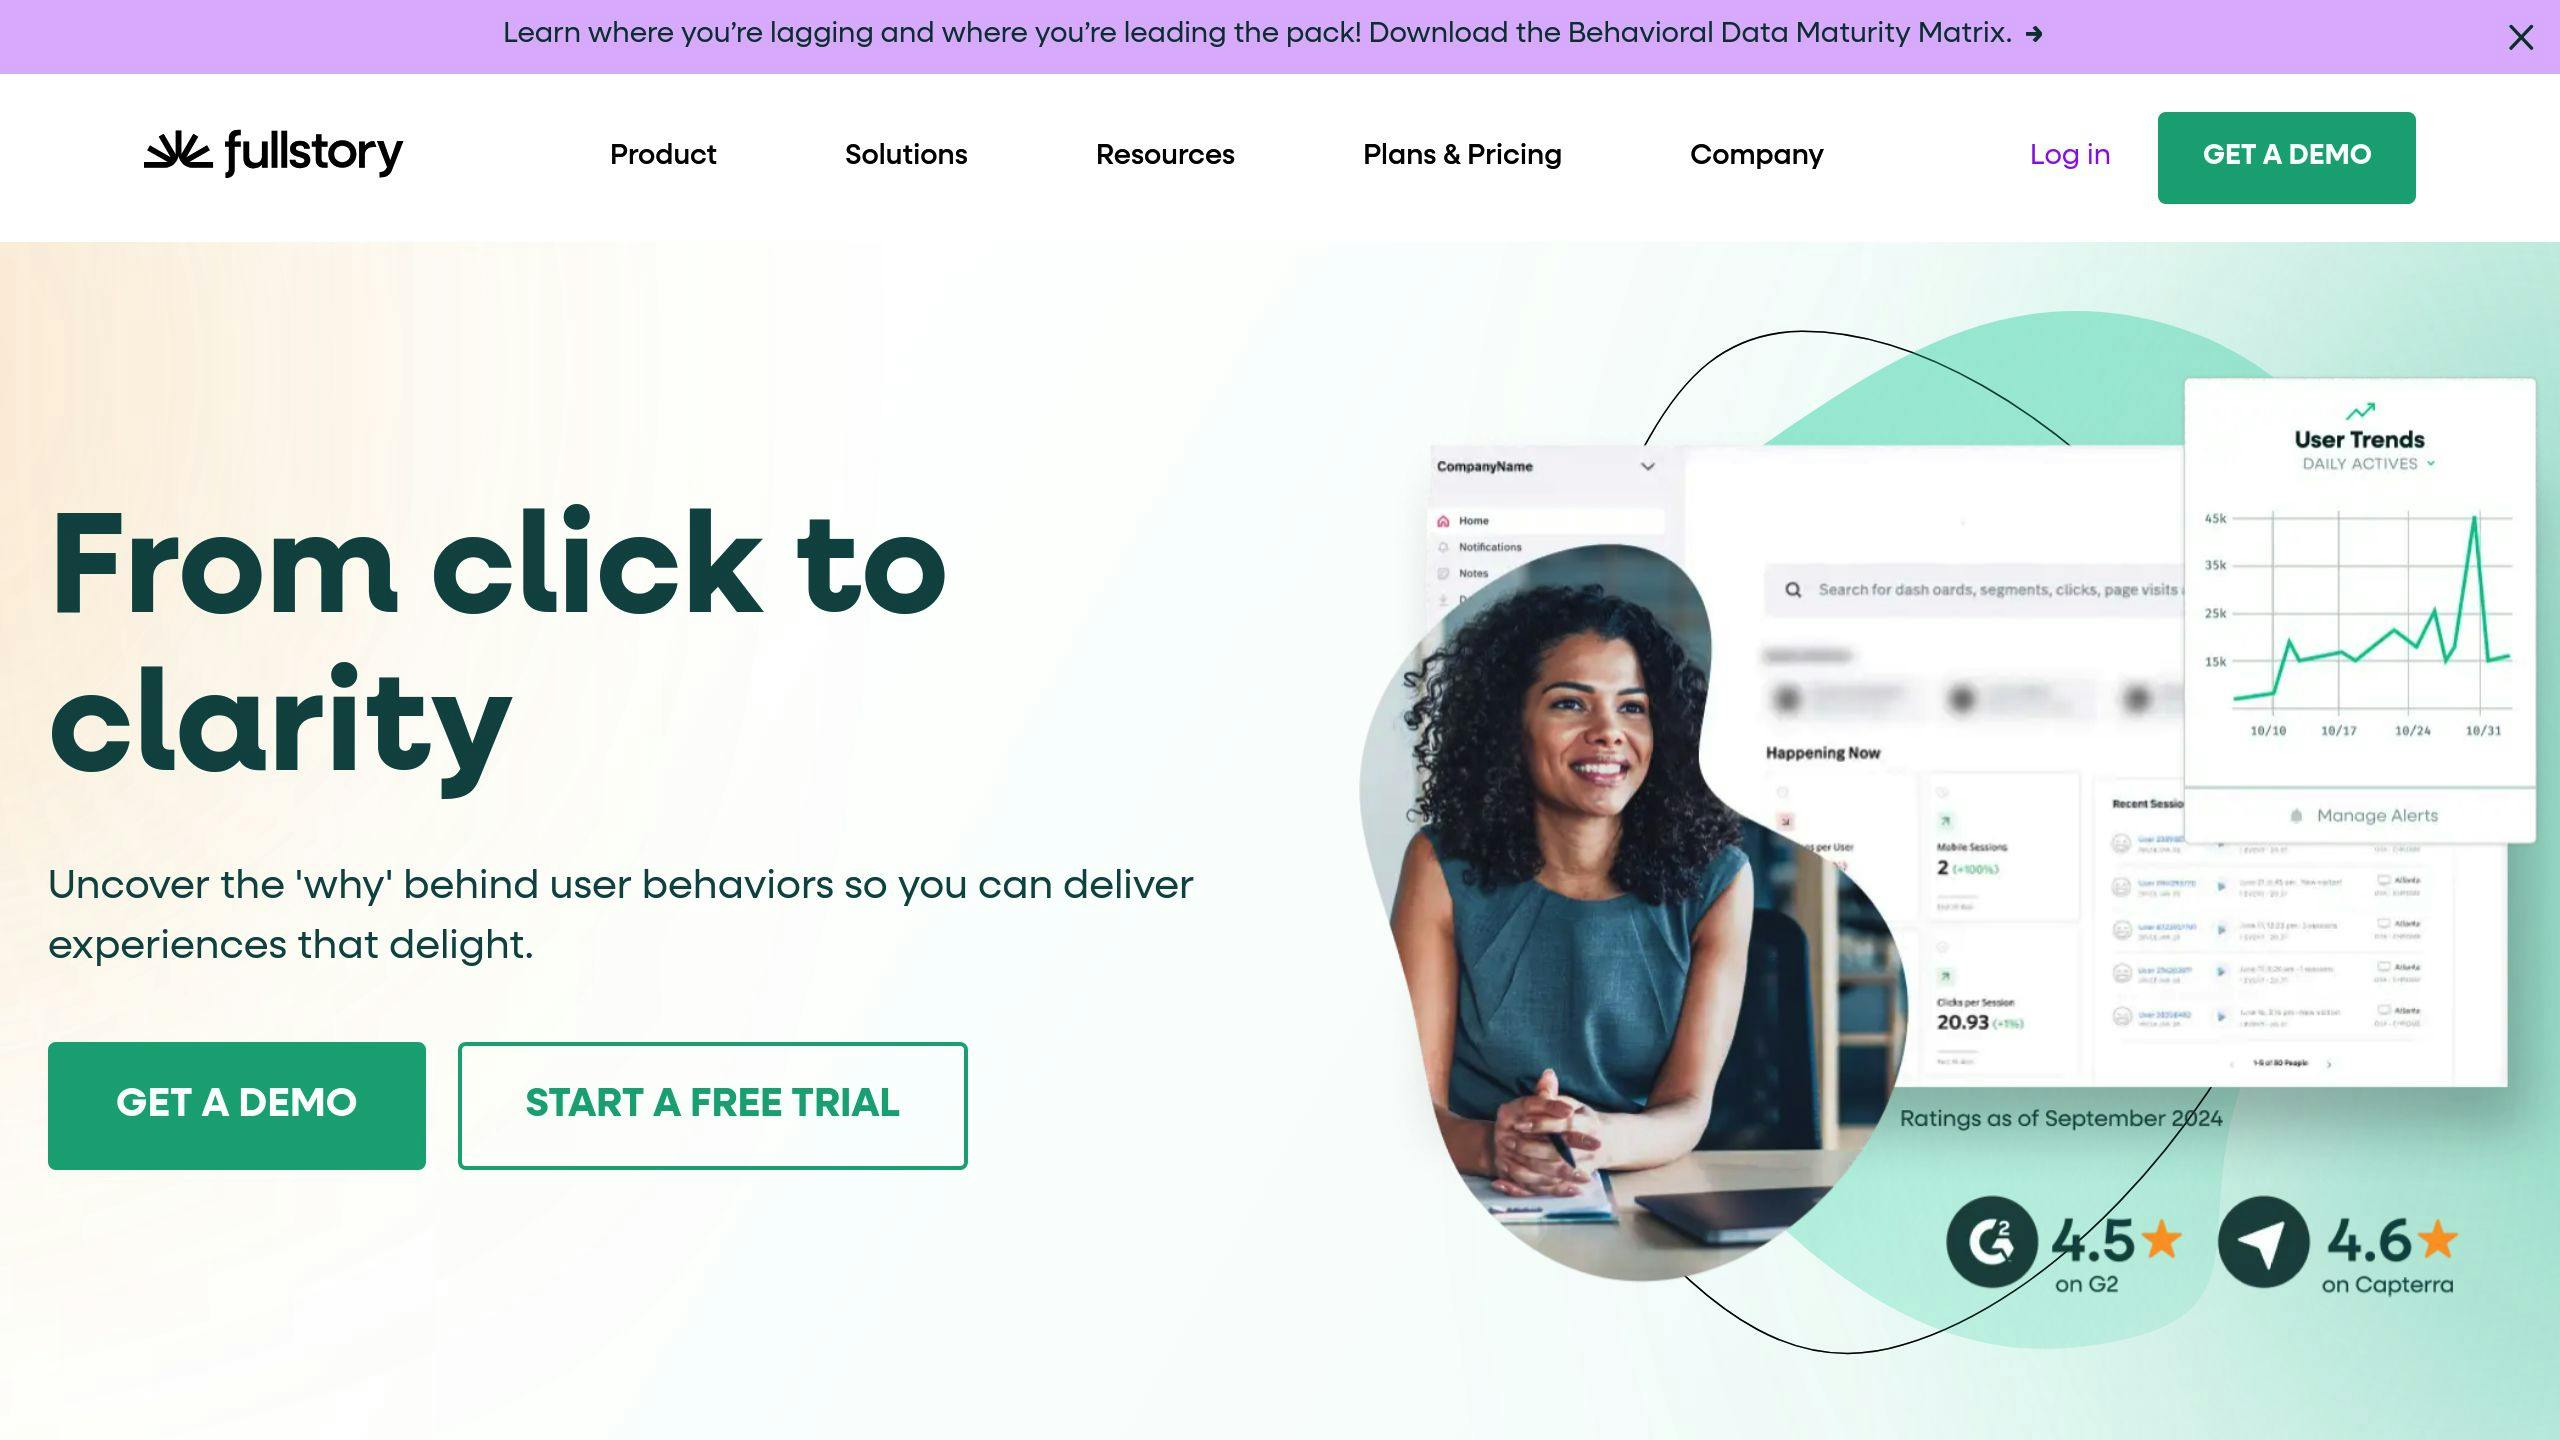
FullStory helps teams see how users interact with websites and apps by combining heatmaps with digital experience tracking.
| Feature Category | Capabilities |
|---|---|
| Heatmap Types | - Click maps showing where users engage - Scroll depth tracking - Rage clicks detection - Dead clicks identification - Error clicks monitoring |
| Data Analysis | - Smart search powered by AI - Instant session data - User journey tracking - Deep funnel analysis - Live session playback |
| Development Tools | - Console error alerts - Network issue detection - Page speed tracking - Load time analysis |
Here's what makes FullStory different:
| Aspect | Details |
|---|---|
| Global Presence | - Main office: Atlanta, USA - Other locations: London, Hamburg, Sydney, Singapore |
| Platform Support | - Standard websites - Web apps - Mobile apps - Multi-step user flows |
| Team Usage | - Product teams - Engineers - Marketers - Support staff |
"FullStory's analytics show us exactly where visitors hit snags on our site. We can spot the difference between random clicks and actual user goals." - IT Reviewer, 3B - 10B USD Manufacturing Company
| Pros | Limitations |
|---|---|
| Records every session | No feedback collection tools |
| Deep funnel insights | Basic team features |
| Error tracking included | Takes time to learn |
| AI search tools | Lots of data storage needed |
| Works for many teams | Hidden pricing details |
FullStory fits best with:
- Big company websites
- Multi-step user flows
- Teams working together
- Deep tech analysis
- Big-scale sites
Price: Try free for 14 days, then $299/month to start
sbb-itb-0e7f3ec
9. Inspectlet
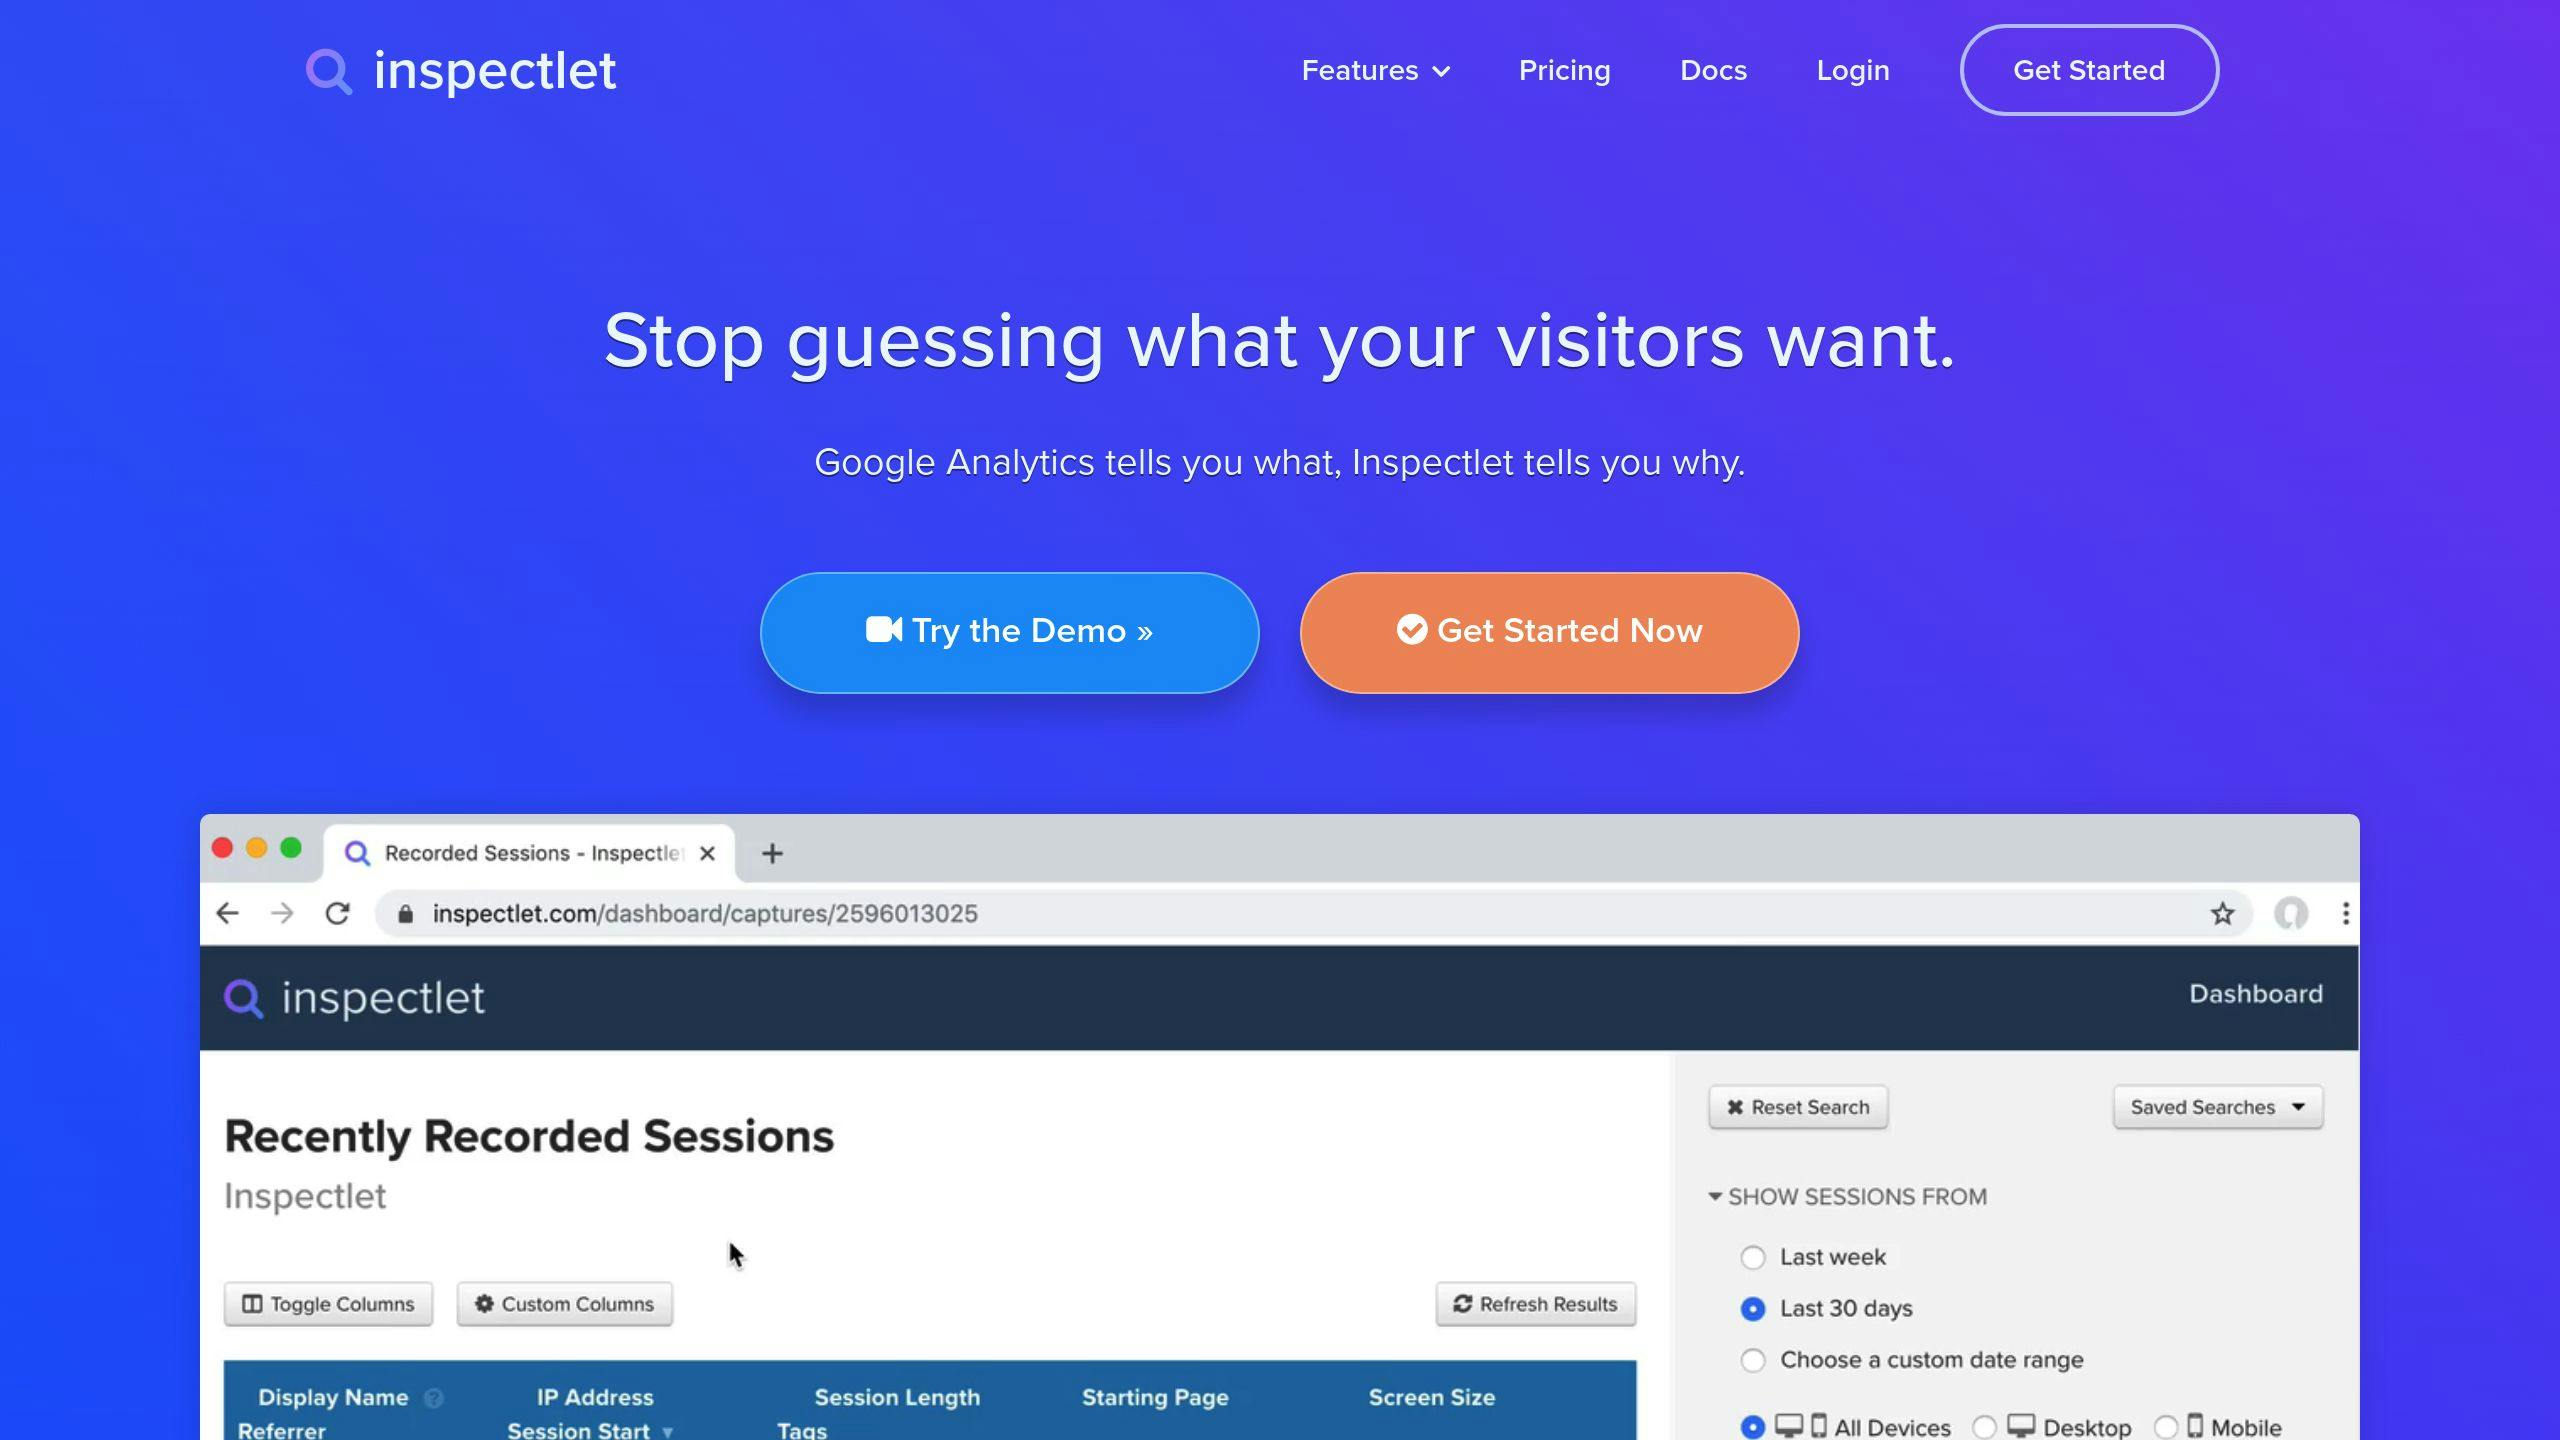
Inspectlet shows you exactly how visitors use your website through recordings and heatmaps. They serve 8,333 customers and hold 1.65% of the heatmap tools market.
| Core Features | Details |
|---|---|
| Session Recording | - Captures every visitor interaction - Tracks mouse moves and clicks - Records keystrokes - Shows scroll depth |
| Heatmap Types | - Click tracking - Mouse movement maps - Scroll depth views - Eye-tracking estimates |
| Form Analytics | - Measures conversion rates - Shows time on forms - Spots hesitation points - Lists skipped fields |
| Testing Tools | - A/B testing - Funnel tracking - User groups - Behavior filters |
| Technical Specs | Implementation |
|---|---|
| Integration | - Drop-in JavaScript code - WordPress plugin |
| Compatibility | - Works with JavaScript sites - Supports HTML5 - Handles AJAX - Works on single-page apps |
| Data Security | - Removes sensitive data - Uses HTTPS - Manages login info |
"I just love the insight it gives me. You can learn so much watching over the shoulder of a user that is using your product." - User of Inspectlet
| Price Plans | Monthly Sessions | A/B Test Visitors | Cost |
|---|---|---|---|
| Free | 2,500 | Limited | $0 |
| Micro | 10,000 | 2 | $39 |
| Startup | 25,000 | 3 | $79 |
| Growth | 50,000 | 6 | $159 |
| Accelerate | 125,000 | 12 | $319 |
Who needs Inspectlet?
- Digital marketing teams
- UX/UI designers
- E-commerce sites
- Customer support teams
- Web developers
"Inspectlet has allowed me to take a deeper look at how our visitors interact with our page and have detailed insights on what's happening, what are they more interested in, what aspects of our page they are not interested, what is confusing and what is helpful." - Juliana A., Chief Executive Officer
10. Plerdy
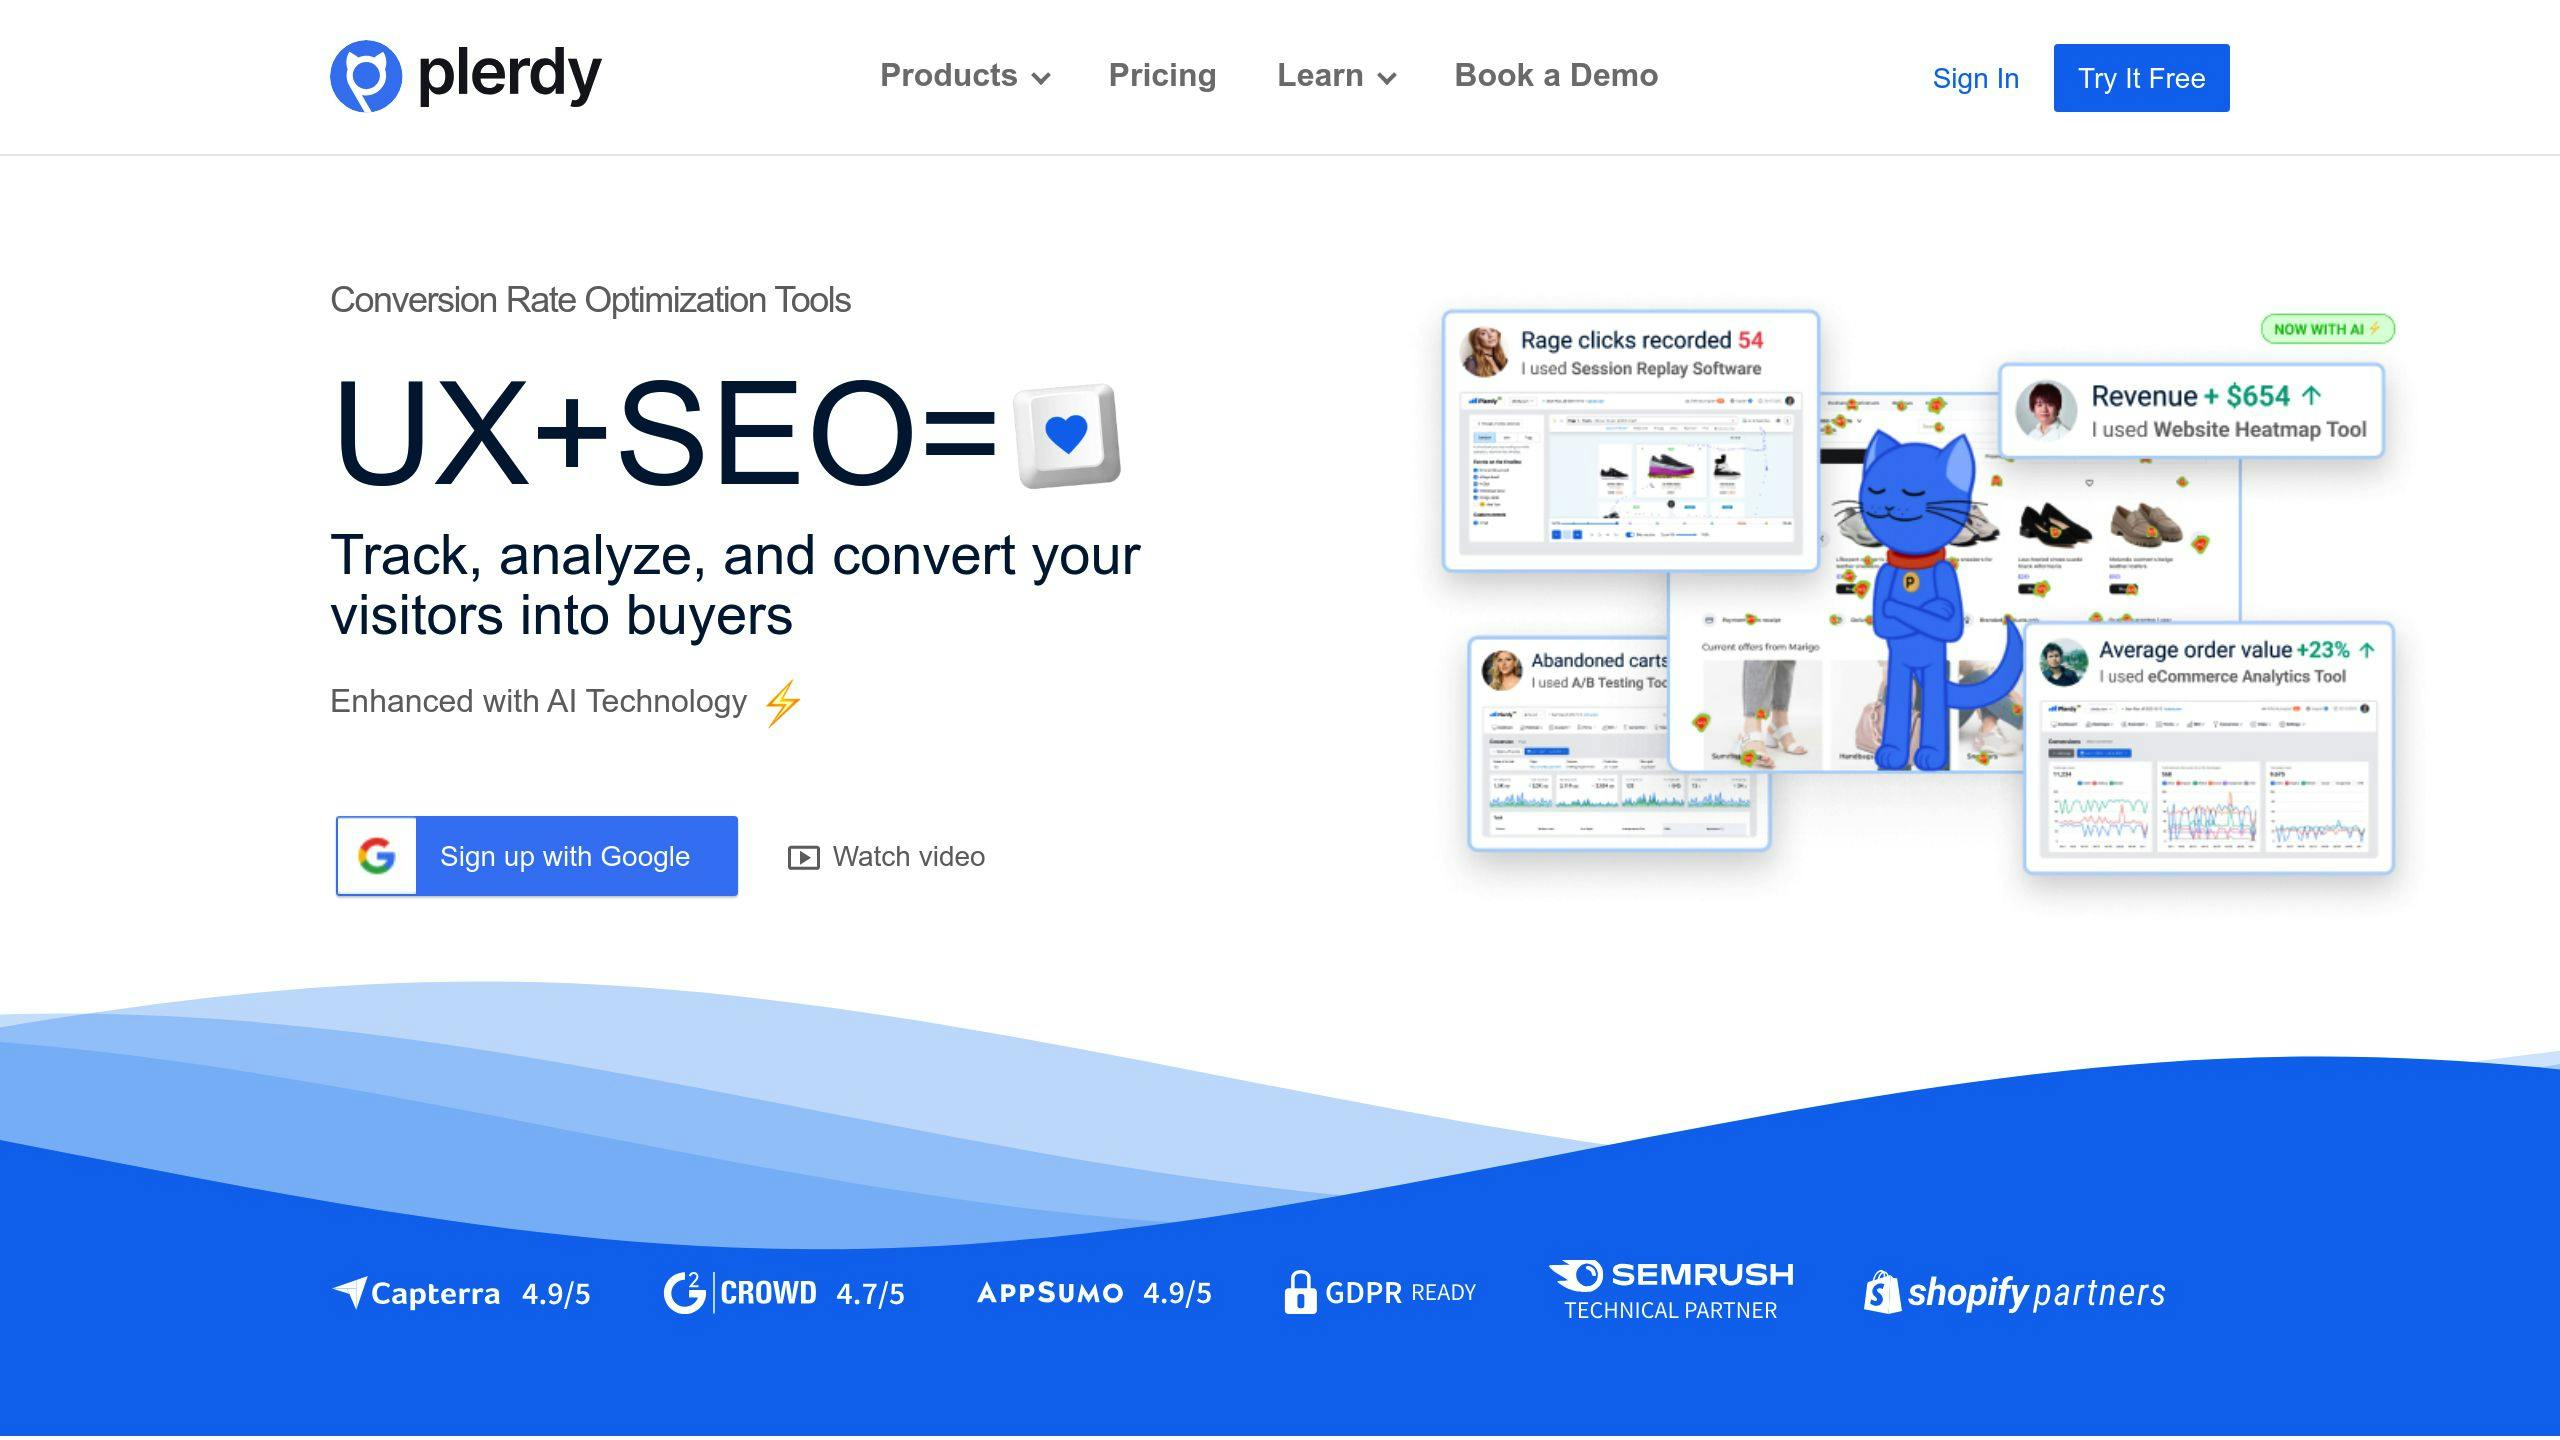
Plerdy shows you exactly how people use your website through heatmaps, recordings, and funnel tracking.
| Feature Type | Capabilities |
|---|---|
| Heatmap Analysis | - Click tracking maps - Scroll depth views - Mouse hover patterns - Click sequence tracking |
| User Behavior Tools | - Session recordings - Event tracking - Conversion funnel analysis - Form analytics |
| Integration Options | - Google Analytics 360 - Google Search Console - Mailchimp - Brevo - SendPulse |
| Price Plan | Cost/Month | Features |
|---|---|---|
| Free | $0 | Basic heatmaps |
| Start | $23 | + Session recording |
| Business | $47 | + Advanced analytics |
| Premium | $79 | + Custom reports |
| Enterprise-1 | $144 | Full access + Support |
Here's What Companies Actually Did With Plerdy:
1. Pro-Street.dk Fixed Their Scroll Problem
Their heatmap showed a big issue: 75% of visitors weren't scrolling down. They fixed it by:
- Making their logo smaller
- Moving ads to better spots
- Putting key content where people could see it
2. 3das.com Cleaned Up Their Site
The heatmap data told them to:
- Take out extra search boxes
- Put social media links at the bottom
- Remove duplicate contact forms
3. Online Store Boosted Views
One store noticed people trying to click product images that weren't clickable. After fixing this:
- Product page views jumped 20%
- More visitors bought stuff
- People found products faster
What You Get:
- See data as it happens
- Get help within 2 hours
- New features roll out regularly
Perfect For:
- Online stores
- Marketing teams
- UX designers
- Website developers
- Business analysts
11. CROTools
CROTools combines heatmaps with user behavior tracking to boost your website's conversion rates.
| Feature Category | What You Get |
|---|---|
| Heatmap Analysis | - Click tracking maps - Scroll depth analysis - Mouse movement patterns - Mobile vs desktop views |
| User Behavior Tools | - Session recordings - Form analytics - Drop-off point tracking - User path analysis |
| Testing Options | - A/B testing - Split URL testing - Multivariate testing - Goal tracking |
Here's what the numbers tell us:
- Desktop converts at 4.14%
- Mobile converts at 1.53%
- You get real-time data updates
- Reports ready in under 60 seconds
| Use Case | Tool Application |
|---|---|
| E-commerce | Track product page engagement |
| Lead Generation | Monitor form completion rates |
| Content Sites | Analyze reading patterns |
| SaaS | Track feature adoption |
The tool packs three main features:
1. Heatmap Analysis Suite
See where people click, scroll, and move their mouse. It shows you the exact spots where readers stop and which parts of your page get the most action.
2. Form Analytics
Know how many people finish your forms, where they quit, and which questions make them leave.
3. Path Analysis
See the exact routes people take on your site. It shows where they get stuck and which paths lead to sales.
| Testing Type | What to Check |
|---|---|
| Click Tests | Button placement and color |
| Scroll Tests | Content visibility and length |
| Movement Tests | Navigation patterns |
| Form Tests | Field completion rates |
CROTools collects data through:
- JavaScript tracking
- Cookie-based user IDs
- Cross-device tracking
- Mobile-specific metrics
Pro tip: Let it run for 2-3 months before making big changes. This gives you enough data to spot real patterns, not just random blips.
12. FigPii
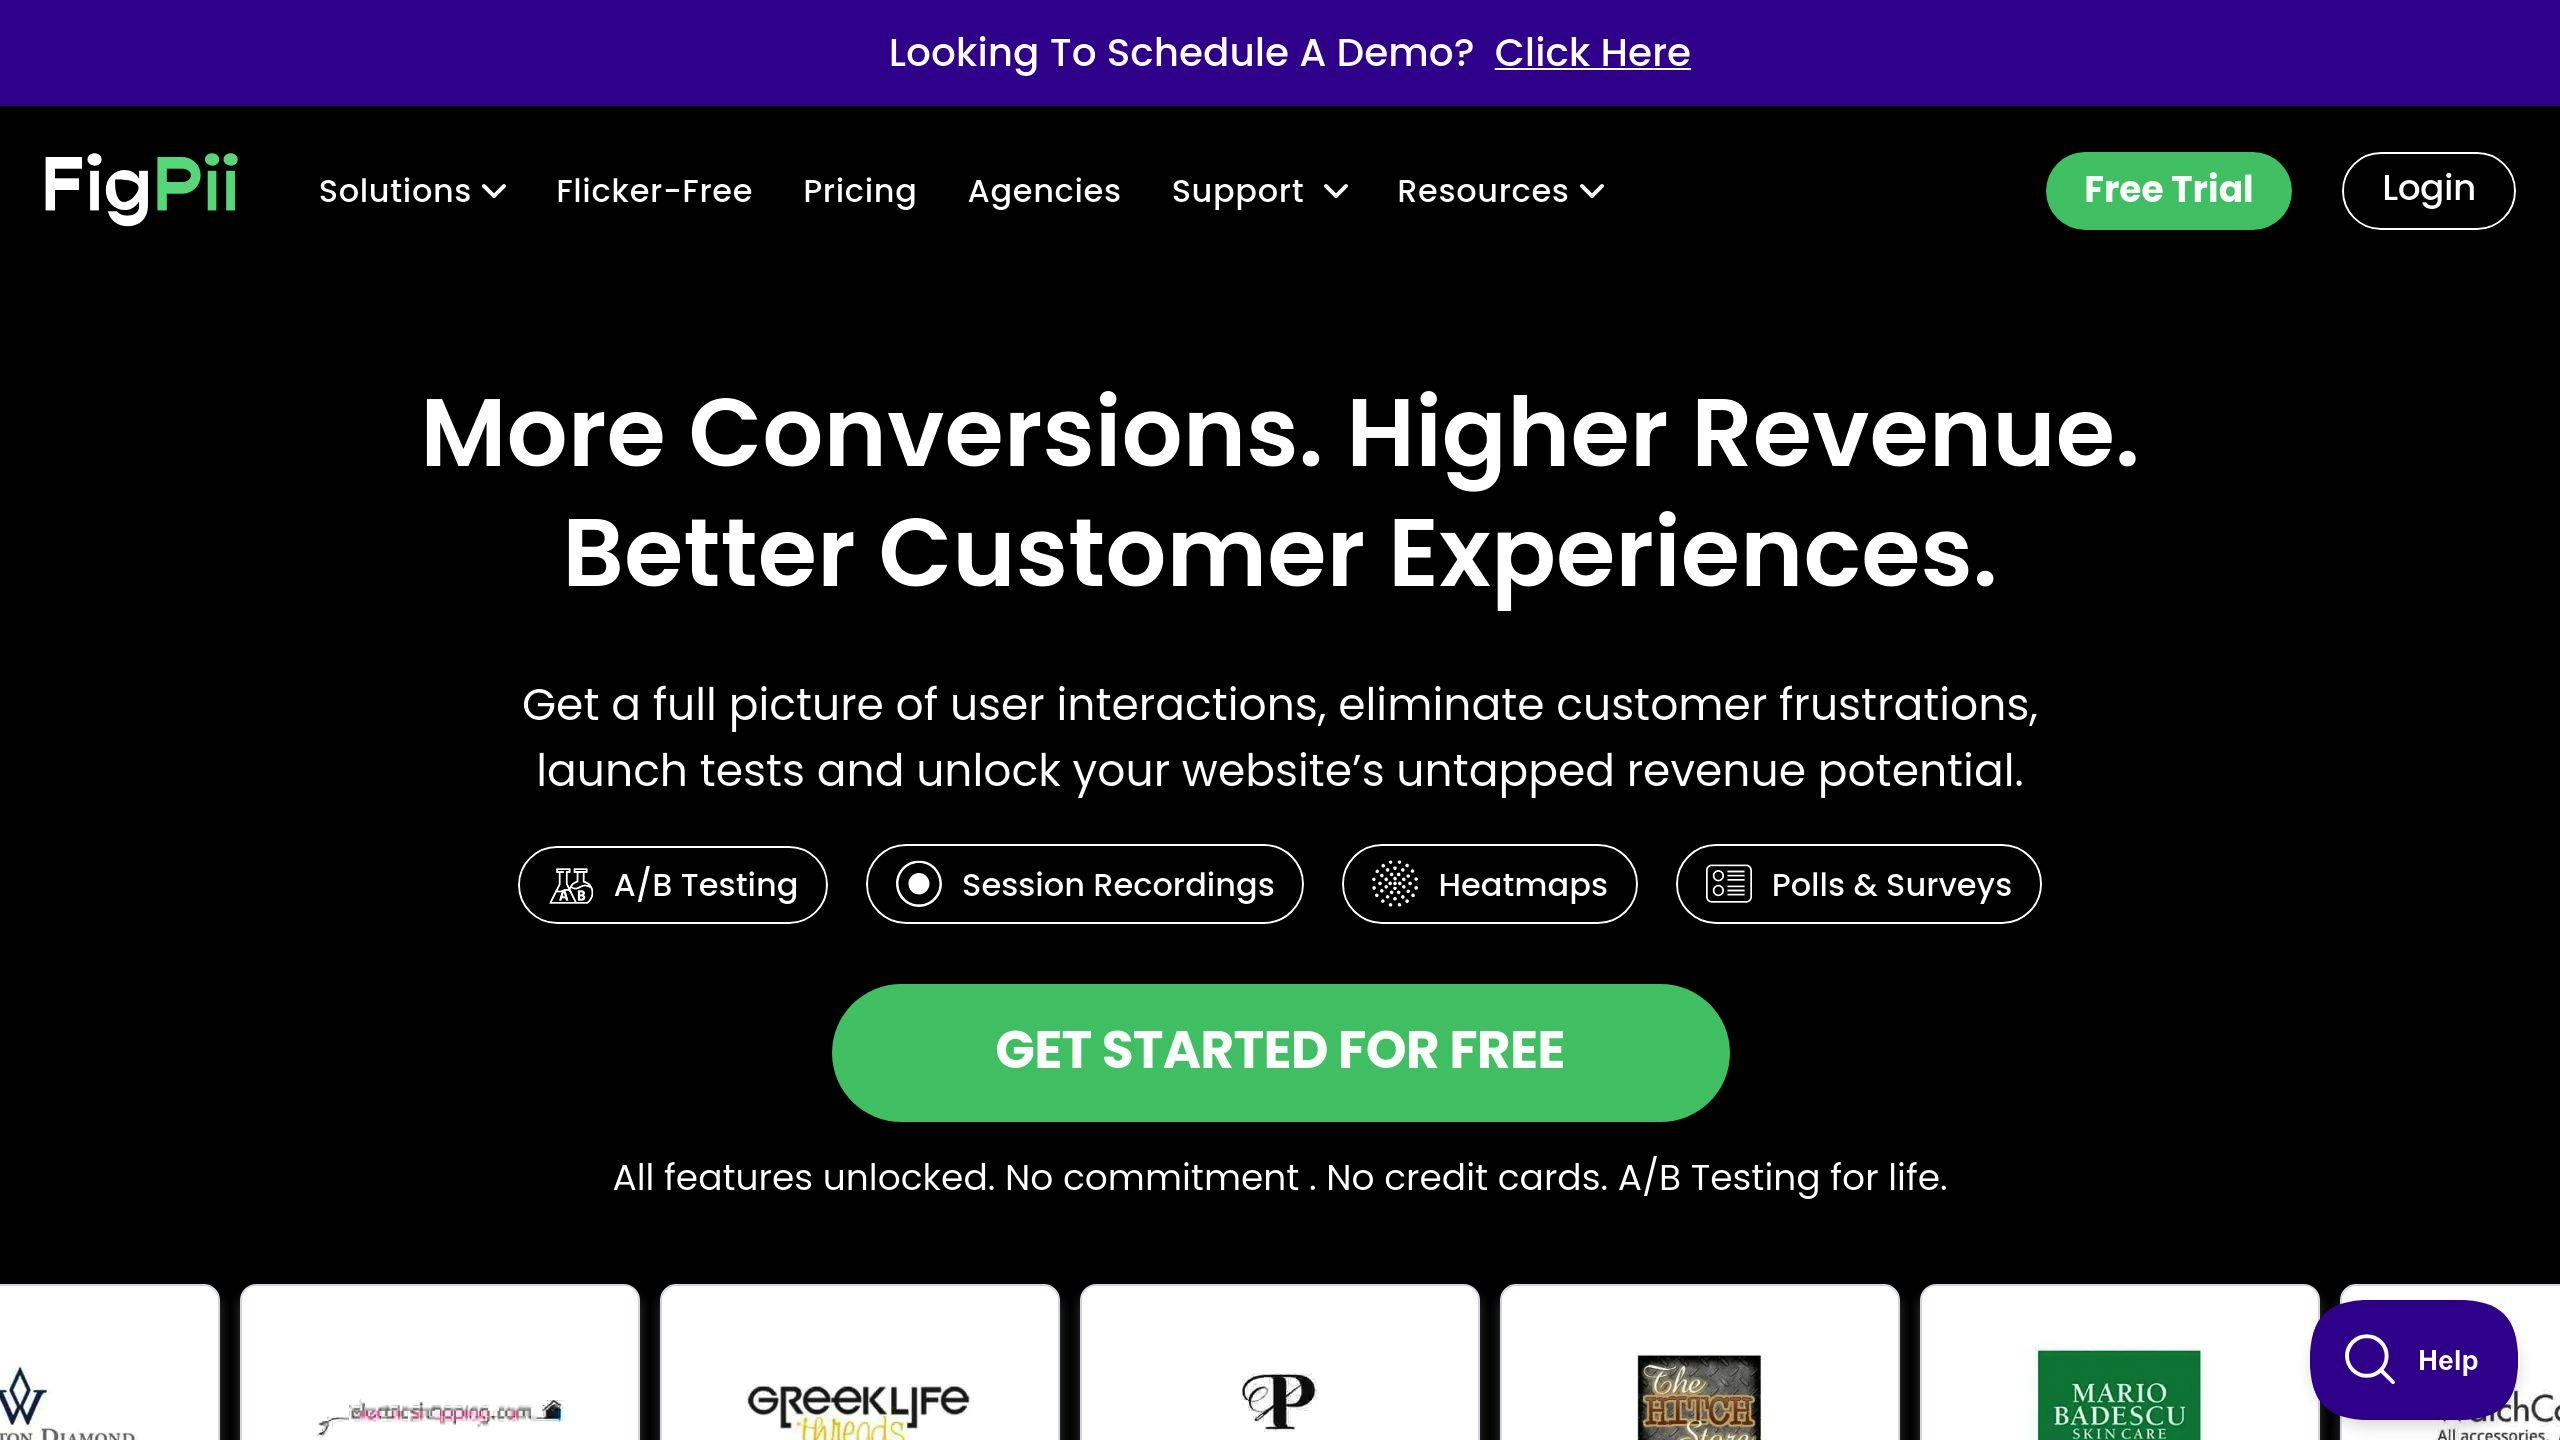
FigPii packs heatmaps, A/B testing, and user tracking into one tool. Here's what 3,700+ brands get from this platform:
| Core Features | Description |
|---|---|
| Heatmap Analysis | - Shows where users click and move - Tracks how far people scroll - Works on phones and computers |
| User Behavior | - Records user sessions - Tracks element performance - Monitors visitor actions |
| Testing Tools | - Splits traffic for A/B tests - Runs user surveys - Tests different content versions |
What makes FigPii different:
- 99.99% uptime - your data keeps flowing
- Follows GDPR and CCPA rules
- Shows data as it happens
| Integration Options | Purpose |
|---|---|
| Google Analytics | See how your site performs |
| BigCommerce | Check store metrics |
| Shopify | Make your store better |
| WordPress | Watch how content works |
| ClickFunnels | See how sales funnels convert |
"FigPii has VERY slick AB testing functionality, which in my opinion is better than Unbounce in this regard and on-part with Convert and VWO." - Wynne Pirini, Chief Technical Officer @ MeasureBit
The numbers speak for themselves (from 21 reviews):
- Customer service: 4.9/5
- Features & functionality: 4.7/5
- Ease of use: 4.9/5
| Training Resources | Format |
|---|---|
| Live Sessions | Direct help when you need it |
| Documentation | Clear how-to guides |
| Video Tutorials | Watch and learn |
| Webinars | Learn with others |
"I love FigPii. It's really simple in use and doesn't overload you with unnecessary data." - Alex H., CEO
Pick your plan:
- Standard: $49.99/month
- Premium: $120/month
Both plans give you heatmaps. Premium adds more A/B testing power.
13. Attention Insight
Attention Insight is an AI tool that shows you where users will look on your designs. It's fast and accurate - matching real eye-tracking data 90-96% of the time, based on 5.5 million data points.
| Feature | Details |
|---|---|
| AI Analysis | - Gets results in under 1 minute - Works on web pages and images - Follows GDPR rules |
| Design Tools | - Figma plugin - Adobe XD integration - Sketch plugin - Chrome extension |
| Testing Options | - Compare designs without live users - Check above-the-fold impact - See attention scores |
The big plus? You can catch design problems BEFORE going live. No more expensive fixes after launch.
| Plan | Price | What You Get |
|---|---|---|
| Free | $0 | 5 designs/month, 1 user |
| Solo | $21/month | Main features + watermark |
| Small Team | $140/month | No watermark, extra credits |
| Team | $434/month | Live training + support manager |
Here's the thing: Attention Insight isn't like regular heatmap tools. Instead of showing you where real users click, it PREDICTS where they'll look. That means you can test designs before launch - but you won't see actual user behavior.
"What makes this tool special? It's built on years of psychology research. Perfect for testing designs before they hit production." - Audrius Alisaukas, CEO of Dancly
They've just added:
- A cleaner, simpler interface
- Google Analytics connection
- Better mobile testing tools
"This tool is a game-changer. It brings enterprise-level testing to small teams. I just landed a $3K project using it to prove concepts to a client." - Leonardo Wolff, Founder of Eikonikos
It's perfect for:
- Testing designs before launch
- Checking how you stack up against competitors
- Making sure important elements get seen
- Showing clients why your designs work
The catch: You won't see real user behavior - just predictions (though they're pretty accurate).
14. Browsee
Browsee helps you find UX problems fast by combining heatmaps, session replays, and AI analysis.
| Feature | Details |
|---|---|
| Core Tools | - Heatmaps with behavior clusters - Session recordings - User segmentation - Funnel analysis - Cross-device tracking |
| Performance Tools | - Chrome Core Vitals tracking - AJAX load time monitoring - Error reporting - Page speed analysis |
| AI Features | - Auto-generated insights - UX issue alerts - Behavior pattern detection |
Here's what makes Browsee different: Their AI watches your site 24/7 and pings you when users run into problems.
| Plan | Price/Month | Features |
|---|---|---|
| Free | $0 | Basic heatmaps and recordings |
| Plus | $49 | More sessions + segmentation |
| Pro | $103 | AI insights + full features |
| Executive | $239 | Custom limits + priority support |
The tool spots patterns by grouping similar user behaviors together - something you'd probably miss just looking at raw data. It also tracks your site's performance across different browsers.
What's new in 2024:
- Page stories that give you quick insights
- Tracking of slow AJAX requests
- Better ways to filter your sessions
Perfect if you need to:
- See where people drop off in your sales funnel
- Track how user behavior shifts
- Find technical problems hurting your UX
- See how content changes affect users
Bottom line: There's a free plan, but you'll want to pay up to get those sweet AI features that make Browsee worth it.
15. Zoho PageSense
Zoho PageSense shows you exactly how visitors interact with your website AND lets you test different versions to boost conversions. Here's what you get:
| Feature Category | Capabilities |
|---|---|
| Visitor Analysis | - Click patterns tracking - Mouse movement recording - Scroll depth monitoring - Form analytics - Funnel analysis |
| Testing Tools | - A/B testing with visual editor - Goal tracking - Custom filters - Session recordings |
| Cross-Platform | - Desktop tracking - Mobile device support - Tablet optimization - Single-page app support |
The tool gives you 4 key reports:
| Report Type | What You'll See |
|---|---|
| Clickmaps | Most/least clicked elements |
| Scrollmaps | Page depth engagement |
| Attention Maps | Areas getting most focus |
| Form Reports | Drop-off points in forms |
Here's what it costs:
| Plan | Monthly Price | Visitor Limit |
|---|---|---|
| Free Trial | $0 | 5,000 visitors |
| Standard | $19 | 10,000 visitors |
| Professional | $89 | 50,000 visitors |
| Enterprise | $470 | 500,000 visitors |
"I saw exactly what people did on my website and made changes that improved their experience." - Alan, CEO
Why it's different:
- Built-in A/B testing (no need for extra tools)
- Connects with your other apps
- Filter visitors by behavior
- Install with one code snippet
Perfect for:
- Teams who want heatmaps + A/B testing in one tool
- Websites tracking users across devices
- Anyone who needs deep form analytics
- Single-page app owners
Tools at a Glance
Here's what you need to know about the top heatmap tools:
| Tool | Best For | Starting Price | Key Features |
|---|---|---|---|
| Hotjar | Small to medium businesses | $39/month | Heatmaps, session recordings, feedback polls |
| CrazyEgg | A/B testing focus | $99/month | A/B testing, heatmaps, scrollmaps |
| Mouseflow | Deep behavior analysis | $39/month | Session replays, form analytics, keystroke logging |
| Lucky Orange | Live engagement | $32/month | Live chat, heatmaps, conversion funnels |
| Microsoft Clarity | Budget-conscious teams | Free | Basic heatmaps, session replays |
| Smartlook | Mobile app analysis | $55/month | Rage click detection, advanced filtering |
| FullStory | Enterprise needs | Custom | Advanced search, detailed analytics |
| Zoho PageSense | A/B testing + heatmaps | $19/month | Built-in A/B testing, form analytics |
What Users Think
| Tool | G2 Rating | Capterra Rating |
|---|---|---|
| Mouseflow | 4.6/5 (500+ reviews) | 4.7/5 (100+ reviews) |
| Hotjar | 4.3/5 (300+ reviews) | 4.7/5 (500+ reviews) |
| FullStory | 4.5/5 (300+ reviews) | 4.6/5 (60+ reviews) |
Data Limits
| Plan Type | Average Pageviews | Data Storage |
|---|---|---|
| Free Plans | 1,000-5,000/month | 30 days |
| Basic Plans | 10,000/month | 90 days |
| Pro Plans | 100,000/month | 1 year |
| Enterprise | Unlimited | Custom |
What Connects With What
| Tool | Key Integrations |
|---|---|
| Hotjar | Google Analytics, Jira, Zapier |
| CrazyEgg | WordPress, Shopify, Wix |
| Mouseflow | HubSpot, Adobe Analytics |
| FullStory | Slack, Jira, Google Analytics |
Features By Plan Level
| Feature Type | Basic Plan | Pro Plan | Enterprise Plan |
|---|---|---|---|
| Click Tracking | ✓ | ✓ | ✓ |
| Scroll Maps | ✓ | ✓ | ✓ |
| Session Recording | Limited | Full | Full + API |
| User Segmentation | Basic | Advanced | Custom |
| Form Analytics | × | ✓ | ✓ |
| API Access | × | Limited | Full |
What You'll Pay
| Business Size | Monthly Cost | Recommended Tools |
|---|---|---|
| Small | $10-50 | Microsoft Clarity, Lucky Orange |
| Medium | $50-100 | Hotjar, Mouseflow |
| Large | $100-200 | CrazyEgg, Smartlook |
| Enterprise | Custom | FullStory, Contentsquare |
How to Set Up Your Heatmap Tool
Here's exactly how to get your heatmap tool up and running.
The Setup Process
First, you'll need to add your tracking code. Here's what to do:
- Copy your unique JavaScript code
-
Paste it in your site's
<head>section - Wait about 30 minutes
- Check your dashboard to make sure it's working
- Pick which pages you want to track
| What You Need | Why It Matters | How to Do It |
|---|---|---|
| Tracking Code | Collects user data | Add to <head> |
| Page Selection | Focus on key pages | Choose high-traffic URLs |
| IP Filters | Clean data | Block internal traffic |
Types of Tracking
Your heatmap tool can track different things:
| Type | Shows You | Best For |
|---|---|---|
| Click Maps | Where users click | Testing buttons & links |
| Scroll Maps | How far they read | Content engagement |
| Move Maps | Mouse movement | User attention |
| Recordings | Full sessions | Deep behavior analysis |
Privacy Rules You Must Follow
Don't skip this part:
| Where | What You Need | What to Do |
|---|---|---|
| EU | GDPR consent | Add consent banner |
| Everywhere | Privacy policy | Tell users about tracking |
| All Browsers | DNT settings | Respect user choices |
Quick Tips
- Put your code in your site template
- Wait 2-4 weeks before looking at data
- Use Google Tag Manager if you can
- Track across all devices
Fix Common Problems
Having issues? Here's what to check:
| Problem | Fix |
|---|---|
| No Data | Check your <head> code |
| Missing Pages | Look for missing code |
| No Mobile Data | Turn on mobile tracking |
| Site Too Slow | Move code placement |
Storage Limits
Know your limits:
| Plan | Sessions | How Long |
|---|---|---|
| Free | 1,000-5,000 | 30 days |
| Basic | 10,000 | 90 days |
| Pro | 100,000 | 1 year |
| Enterprise | Your choice | Your choice |
Check your data once a week. Change your settings based on what you see.
Final Thoughts
Here's what matters when picking a heatmap tool in 2024:
| Core Factor | Details | Impact |
|---|---|---|
| Data Collection | Click, scroll, mouse movement | Shows how people use your site |
| Cost | $0-198/month | Fits your spending plan |
| Setup | Works with your tools | Quick to get running |
| Usage Limits | 5,000-100,000+ sessions | Sets what you can track |
Here's what you'll pay:
| Level | Cost/Month | Who It's For |
|---|---|---|
| Free | $0 | Testing, small sites |
| Starter | $29-39 | Sites that want more |
| Pro | $55-75 | Business sites |
| Big Business | $198+ | Major operations |
What's next for heatmaps:
- AI that spots patterns
- Better user groups
- Improved mobile data
- Tougher data protection
Before you buy:
- Start with free plans
- Know your session caps
- Check data storage time
- Test mobile tracking
Watch these red flags:
- Extra costs that pop up later
- Getting locked into contracts
- Problems getting your data out
- Slow help when stuck
Know these numbers:
| What to Track | Basic Need | Better to Have |
|---|---|---|
| How Long Data Stays | 30 days | 90+ days |
| Monthly Views | 5,000 | 100,000 |
| Data Updates | Daily | Live |
| Getting Data Out | CSV | CSV, PDF, API |
Small sites? Microsoft Clarity's free plan might work. Bigger sites need more muscle from paid tools like Hotjar or CrazyEgg.
Pick what you'll use, not what looks fancy. Start basic, test it out, then grow when needed.
Common Questions
Does my site need a heatmap tool?
Here's the deal: If your site gets 5,000+ monthly visitors, heatmaps show you exactly how people interact with your pages. They reveal clicks, scrolls, and mouse movements that basic analytics miss.
How much data do I need for good heatmaps?
| Visitor Count | Data Quality | Time to Collect |
|---|---|---|
| 2,000-3,000 | Basic patterns | 1-2 weeks |
| 5,000+ | Clear trends | 2-4 weeks |
| 10,000+ | Strong insights | 1 month |
Will heatmaps slow down my site?
Nope! Modern heatmap tools add less than 100ms to load time. They use tiny JavaScript files that load AFTER your main content.
What about mobile heatmaps?
Today's tools handle mobile like a pro. They track:
- Screen sizes
- Touch gestures
- Scroll depth
- Pinch/zoom actions
How accurate are heatmaps?
Tests show AI-powered heatmaps hit 95% accuracy. But watch out for these issues:
| Factor | Impact |
|---|---|
| Dynamic content | Wrong click tracking |
| Pop-ups | Blocked tracking |
| Single-page apps | Extra setup needed |
| iFrames | Missing data |
What should I track?
| Type | Shows You |
|---|---|
| Click maps | Where users click |
| Scroll maps | How far they read |
| Move maps | Mouse patterns |
| Rage clicks | Frustration spots |
How do I fix tracking problems?
Quick fixes:
- Check tracking code on all pages
- Give it 30+ minutes
- Verify CSS loading
- Whitelist tool IPs
What about privacy?
Modern tools play by the rules (GDPR and others):
- Opt-out options
- Personal data masking
- Secure storage
- Custom tracking controls
Can I export the data?
| Tool | Export Types |
|---|---|
| Hotjar | CSV, PNG |
| CrazyEgg | PDF, PNG |
| Mouseflow | CSV, API |
| Microsoft Clarity | CSV |
How do tools rank on G2?
| Tool | Rating | Reviews |
|---|---|---|
| Mouseflow | 4.6/5 | 500+ |
| Hotjar | 4.3/5 | 300+ |
| CrazyEgg | 4.2/5 | 100+ |
How long is setup?
You'll spend 5-15 minutes tops. Just add the code, set up your first heatmap, and wait 30 minutes for data to start flowing.
FAQs
What is the best heat mapping tool?
Looking for a heat mapping tool? Here's what you need to know about the top options:
| Tool | Best For | Starting Price |
|---|---|---|
| Plerdy | First-click analysis | $21/month |
| Hotjar | Multi-dimensional behavior insights | $39/month |
| Lucky Orange | Element analytics | $32/month |
| VWO | User segmentation | $49/month |
| Crazy Egg | Novice UX specialists | $24/month |
| Inspectlet | Form analytics | $39/month |
Each tool does something different:
Hotjar combines behavior tracking with session recordings. It's like having a video of how people use your site.
Crazy Egg keeps things simple. If you're new to heat mapping, this is your best bet.
Lucky Orange zooms in on specific parts of your pages. Want to know why people aren't clicking that button? This tool will tell you.
VWO helps you understand different user groups. Think of it as heat mapping with a targeting superpower.
Plerdy shows you where people click first. It's perfect if you want to track those crucial first interactions.
Inspectlet specializes in forms. It shows you exactly where people give up on your forms.
Here's how to pick the right one:
- Check your budget
- Consider your team's tech skills
- Think about what you NEED to track
- Look at your website size
The good news? You can try them all for free before you buy. No need to commit without testing first.
